Download
1 / 34
340 likes | 439 Vues
Explore the latest trends and forecasts in the U.S. construction industry, covering GDP, housing starts, remodeling, and structural panel production.

E N D
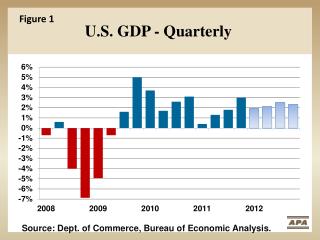
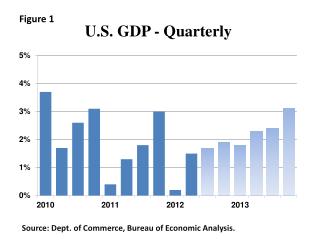
Figure 1 U.S. GDP - Quarterly Source: Dept. of Commerce, Bureau of Economic Analysis.
Figure 2 U.S. GDP - Annual Source: Dept. of Commerce, Bureau of Economic Analysis. APA forecast.
Canada GDP Figure 3 Source: Statistics Canada. APA Forecast
U.S. Housing Starts Figure 4 Source: census.gov/const/.
Figure 5 U.S. Single-family Housing Starts Thousand 950 920 850 780 625 500 431 Source: Dept. of Commerce, APA forecast.
Figure 6 U.S. Multifamily Housing Starts Thousand 390 380 325 290 240 230 178 Source: Dept. of Commerce, APA forecast.
Figure 7 U.S. Single-family, Multifamily and Manufactured Housing Forecast Thousand Underlying Demand: 1.64 Million. 1,405 1,360 1,240 1,130 923 785 661 Source: Dept. of Commerce, APA forecast.
Figure 8 Residential RemodelingOwner-Occupied Improvements* - Annual through 2011. Monthly in 2012. Billions of dollars July 2012 Annual Rate *Census discontinued a broader survey of remodeling in 2008. It included rental, vacant and seasonal properties. Their surveys now miss 55% to 60% of all remodeling expenditures. http://www.census.gov/construction/30index.htmlPrivate construction
Figure 9 Retail SalesBuilding Materials & Supplies Seasonally Adjusted Annual Rate $ Billions $20.2 Billion Source: U.S. Department of Commerce. Census Bureau.http://www.census.gov/retail/
Residential RemodelingOwner-Occupied Improvements Figure 10 Billions of dollars http://www.census.gov/const/www/c30index.html, Private construction
Figure 11 Nonresidential - Heavy Wood Using SectorsLodging, Office, Healthcare & Education Buildings Billion $2010 Source: Dept. of Commerce, Report C30. APA forecast.
Figure 12 Heavy Wood Using Sectors2012 Source: Source: Dept. of Commerce, Report C30.
Figure 13 Nonresidential – Other Building CategoriesCommercial, Religious, Recreation, Transportation, Manufacturing and Communication. Billion $2010 Source: Dept. of Commerce, Report C30. APA forecast.
Figure 14 Total Nonresidential Building ConstructionExcludes Roads, bridges, sewage and water supply projects. Billion $2010 Source: Dept. of Commerce, Report C30. APA forecast.
Figure 15 Manufacturing Index - Monthly Monthly Year-Over-Year % Change Source: Federal Reserve G.17, Table 12.
U.S. Manufactured Goods Exports6 months 2012 Figure 16 Will slower world growth affect the U.S. and Canada? • $Billions • World $674 • Canada 133 • Mexico 96 • China 36 • Japan 29 • United Kingdom 25 • Germany 22 • Brazil 19 • Netherlands 18 • South Korea 18 • Hong Kong 18 Source: Foreign Trade Division. U.S. Census Bureau
Figure 17 Manufacturing Index - Annual Index: 2007=100 http://www.federalreserve.gov/releases/G17/ , APA forecast.
Figure 18 Household and Institutional Furniture, and Kitchen Cabinet Industry Index Source: Federal Reserve G.17, Industrial Production
Figure 19 Furniture Production Forecast 2007= 1.0 Source: Clear Vision Associates, June, 2012
Figure 20 Residential DemandStructural Panels – U.S. and Canada BSF 26.6 23.4 18.3 16.4 16.0 14.8 13.7 11.9 11.5 10.0 9.0 8.9 7.9
Figure 21 Remodeling, Industrial, Nonresidential & Export Demand for Structural Panels BSF 21.8 20.9 20.3 20.3 20.0 20.0 19.6 19.0 18.4 17.7 17.9 17.5 17.5
Figure 22 Total Structural Panel Production BSF 43.1 42.4 38.5 35.7 35.4 33.6 32.2 30.7 29.8 27.6 26.2 26.1 24.3
Figure 23 Glulam End Uses2012 U.S.: 190 Million Board Feet Industrial/Other7% Nonresidential Construction47% ExportLess than 1% New Residential Construction& Remodeling 45% Source: APA estimates.
Figure 24 Glulam Share of Residential Beams and Headers Share 7% Source: NAHB annual builder surveys
Figure 25 Glulam Production Million Board Ft. 243 214 203
Figure 26 I-joist End Uses2012 U.S.: 351 Million Linear Feet Remodeling 4% Nonresidential, Other5% New Residential 91% Source: APA
Raised Floor Market SharesU.S. Single Family First Floors Only Figure 27 Source: NAHB builder surveys.
Figure 28 I-joist Market ShareU.S. Single Family Raised Floors 52% 52% 45% Source: NAHB builder surveys. APA forecast.
Figure 29 I-joist Production Billion Linear Ft. .600 .545 .471 .457
Figure 30 LVL End Uses2012 U.S. & Canada: 50.0 Million Cubic Feet Beam / HeaderIndustrialRim Board 74% I-joist Flanges 26% Source: APA
Figure 31 LVL Share of Residential Beams and Headers Share 27% Source: NAHB annual builder surveys
Figure 32 I-joists with LVL Flanges% of N.A. Production
Figure 33 LVL Production Million Cubic Ft. 53.9 50.0 41.6 41.1
Figure 34 Residential Beams and HeadersMarket Share Share 56% 27% 7% 5% 3% 2011 First bar details: Built up 42%; Solid Sawn 12%, Wood Truss 2% Not shown: I-joist 2%. Source: NAHB annual builder surveys