Download
1 / 27
270 likes | 401 Vues
This report provides a comprehensive analysis of U.S. and Canadian GDP trends, showcasing quarterly and annual data from the Department of Commerce and Statistics Canada. It highlights the progression of single-family and multifamily housing starts, residential remodeling expenditures, and nonresidential building categories. Additionally, the report details various indexes relevant to manufacturing and production in the furniture, structural panels, and construction sectors. The insights elicited aim to inform industry stakeholders about current economic conditions and forecasts.

E N D
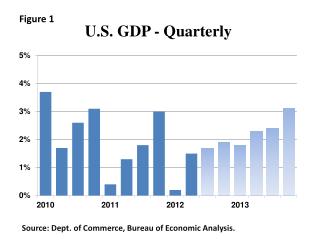
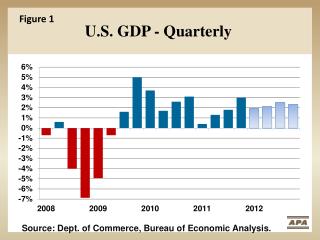
Figure 1 U.S. GDP - Quarterly Source: Dept. of Commerce, Bureau of Economic Analysis.
Figure 2 U.S. GDP - Annual Source: Dept. of Commerce, Bureau of Economic Analysis. APA forecast.
Figure 3 Canada GDP Source: Statistics Canada. APA Forecast
Figure 4 U.S. Single-family Housing Starts Thousand 470 429 Source: Dept. of Commerce, APA forecast.
Figure 5 U.S. Multifamily Housing Starts Thousand 210 178 Source: Dept. of Commerce, APA forecast.
Figure 6 Residential RemodelingOwner-Occupied Improvements Billions of dollars http://www.census.gov/const/www/c30index.html, Private construction
Figure 7 Nonresidential - Heavy Wood Using SectorsLodging, Office, Healthcare & Education Buildings Billion $2010 Source: Dept. of Commerce, Report C30. APA forecast.
Figure 8 Nonresidential – Other Building CategoriesCommercial, Religious, Recreation, Transportation, Manufacturing and Communication. Billion $2010 Source: Dept. of Commerce, Report C30. APA forecast.
Figure 9 Total Nonresidential Building ConstructionExcludes Roads, bridges, sewage and water supply projects. Billion $2010 Source: Dept. of Commerce, Report C30. APA forecast.
Figure 10 Nonresidential vs. ResidentialConstruction CyclesNot adjusted for inflation. $ Billion * Nonresidential spending excludes highways and streets
Figure 11 Manufacturing Index - Monthly Monthly Year-Over-Year % Change Source: Federal Reserve G.17, Table 12.
Figure 12 Manufacturing Index - Annual Index: 2007=100 http://www.federalreserve.gov/releases/G17/ , APA forecast.
Figure 13 Motor Home Industry Index Source: Federal Reserve G.17, Industrial Production
Figure 14 Travel Trailer & Camper Industry Index Source: Federal Reserve G.17, Industrial Production
Figure 15 Household and Institutional Furniture, and Kitchen Cabinet Industry Index Source: Federal Reserve G.17, Industrial Production
Figure 16 Residential DemandStructural Panels – U.S. and Canada BSF 26.6 23.3 18.2 17.2 16.4 14.5 12.0 11.9 10.5 9.3 9.0 8.6 7.9
Figure 17 Remodeling, Industrial, Nonresidential & Export Demand for Structural Panels BSF 21.8 21.5 21.0 20.9 20.1 20.3 20.0 20.0 19.4 18.8 18.0 17.6 17.5
Figure 18 Total Structural Panel Production BSF 43.1 42.4 38.5 37.3 37.1 34.4 31.6 30.7 29.6 27.8 26.2 26.1 24.3
Figure 19 Glulam End Uses2011 U.S.: 170 Million Board Feet Industrial/Other7% Nonresidential Construction51% ExportLess than 1% New Residential Construction& Remodeling 42% Source: APA estimates.
Figure 20 Glulam Production Million Board Ft. 225 213 203 195
Figure 21 I-joist End Uses2011 U.S.: 311 Million Linear Feet Remodeling 4% Nonresidential, Other6% New Residential 90% Source: APA
Figure 22 I-joist Market ShareU.S. Single Family Raised Floors 51.9% 51.9% 44.8% Source: NAHB builder surveys. APA forecast.
Figure 23 I-joist Production Billion Linear Ft. .579 .509 .471 .457
Figure 24 LVL End Uses2011 U.S. & Canada: 39.0 Million Cubic Feet Beam / HeaderIndustrialRim Board 74% I-joist Flanges 26% Source: APA
Figure 25 I-joists with LVL Flanges% of N.A. Production
Figure 26 LVL Production Million Cubic Ft. 48.5 43.4 41.6 41.1
Figure 27 Single-Family Beams and Headers Source: NAHB annual builder surveys