Download
1 / 18
180 likes | 198 Vues
This presentation discusses the assessment and adjustment of bias in the "Multipurpose survey on households - Aspects of daily life," including the estimation of mode effects and adjustment methods.

E N D
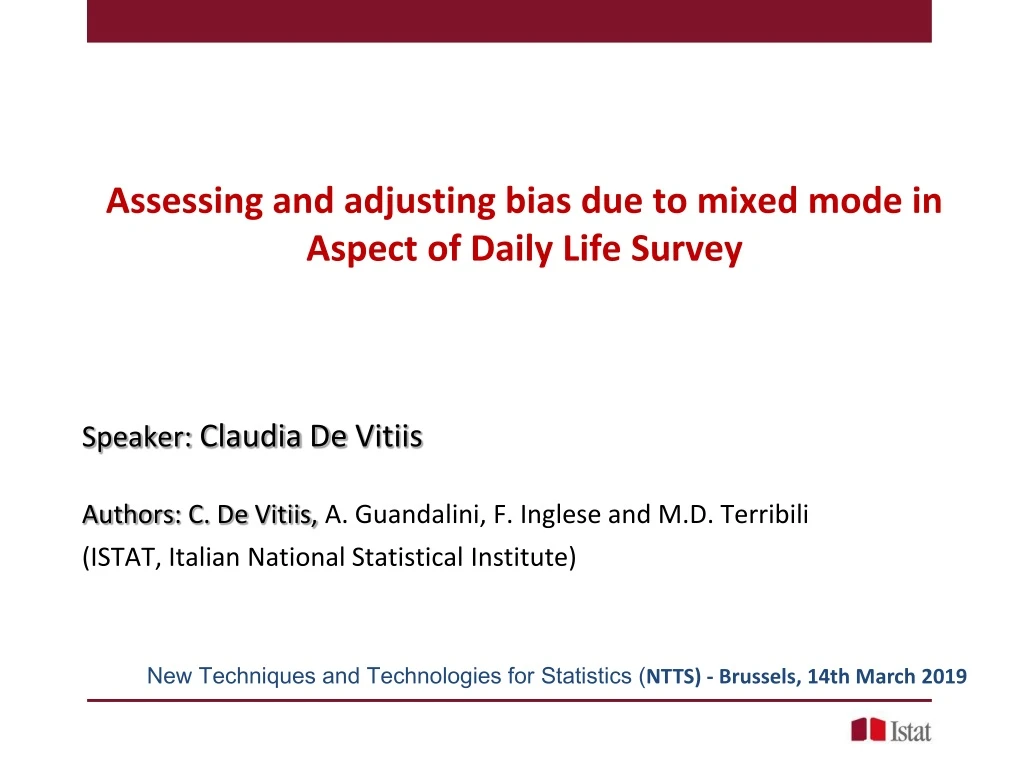
Assessing and adjusting bias due to mixed mode in Aspect of Daily Life Survey Speaker:Claudia De Vitiis Authors: C. De Vitiis, A. Guandalini, F. Inglese and M.D. Terribili (ISTAT, Italian National Statistical Institute) New Techniques and Technologies for Statistics (NTTS) - Brussels, 14th March 2019
Summary • The Mixed Mode in social surveys • The setting of the “Multipurpose survey on households - Aspects of daily life” and the analysis framework • The assessment of the introduction of the mixed mode • The estimate of mode effect (selection and measurement) • The adjustment of mode effect with different methods • Final considerations and future developments Claudia De Vitiis - NTTS, 14th March 2019
Why mixed modes? Mixed mode is spreading especially in social surveys, to contrast declining response rates and coverage, reducing also the total cost of the surveys The use of different data collection techniques helps in contacting different types of respondents in the most suitable way for each of them, so allowing a gain in population coverage and response rate Which drawbacks has this choice? The difficulty of control over mode effects and the confounding between selection and measurement effect (especially in sequential designs) Mode effect refers strictly to measurement error differences due to the mode of survey administration A selection effectgenerally occurs, due to the differences in the distributions of the respondents to the alternative modes, even if this is a desirable aspect of MM strategy How and when dealing with mode effect? Mainly in the planning of the survey (questionnaire and survey design) to limit measurement error as much as possible In the estimation phase to adjust mainly the selection effect, while estimating the measurement effect 1. Mixed mode in social surveys Claudia De Vitiis - NTTS, 14th March 2019
The sample survey “Multipurpose survey on households: Aspects of daily life” Collects information about recreational and cultural activities in free time, such as sports, reading, cinema, music, the Internet, social relations, issues for the quality of life of people Based on a sample of about 24.000 households, selected through a two stage sample design (municipalities/households) from the centralized municipal register (LAC) Mixed technique: sequential web-PAPI A self-compiled questionnaire (web) proposed in the inviting letter sent by ISTAT and after, on non respondent households, direct interview with a questionnaire on paper with an interviewer (PAPI) In 2017:experimentalset up: sequentialweb/PAPI (MM) with a control single mode sample PAPI (SM) The selected sample of individuals was linked to an administrative data base (Archimede Project) through the individual code available from the selection frame to obtain external auxiliary variables 2. The survey settings and analysis framework Claudia De Vitiis - NTTS, 14th March 2019
Analysis framework In this experimental setting, the study is developed on two main levels of analysis the first level is based on the comparison between the two samples SM and MM, to evaluate the impact on the estimates due to the introduction of mixed mode tests were performed on the differences in the estimates from the two sample, SM and MM analyses were conducted to study the bias caused by the total nonresponse in the two samples Total response rates and indicators of response representativeness were evaluated in order to identify differences (especially in terms of magnitude of the bias) that could explain the differences in the estimates of the survey produced with the SM and MM samples 2. Survey settings and analysis framework Claudia De Vitiis - NTTS, 14th March 2019
Analysis framework the second level investigates the mode effect (selection and measurement) of the samples of respondents web and PAPI in the MM design, to analyze the reasons that determine significant differences in the estimates analysis of the mode effect was carried out using methods that make the samples of respondents web and PAPI comparable propensity score (Rosenbaum and Rubin, 1983) to estimate the selection effect and the measurement effect in MM sample instrumental variable approach proposed by Vannieuwenhuyze et al. (2010) has been applied to SM and MM samples, using SM are benchmark mode Finally the estimates deriving from the application of different adjustment methods are compared Calibration on fixed mode proportions (Buelens et al 2015) Calibration using selection effect correction factors (PS) Standard calibration 2. Survey settings and analysis framework Claudia De Vitiis - NTTS, 14th March 2019
To evaluate the differences between the estimates of the some parameters of interest of the survey, obtained with the mixed and the single mode samples, hypothesis tests were carried out (Martin and Lynn, 2011). Test of the differences in proportions through t-test, while the independence between the distributions were evaluated as a whole through the Chi-square test The hypothesis tests concerned the following estimates: Satisfaction for life (Satisfaction) Health conditions (Health) Valuation of the economic situation compared to the previous year (EcoSit) Reading books in the last 12 months (Books) Frequency of seeing friends (Friends) Habit to smoke (Smoke) The difference for Satisfaction, Books and Friends resulted significant 3. The assessment of the introduction of the mixed mode Test of differences between SM and MM estimates Claudia De Vitiis - NTTS, 14th March 2019
The auxiliary variables available for the following analyses and models Auxiliary mode-insensitive variables in ADL survey at household level: Household type: one-component under 55, one-component over 54, couple with children at least one under 25, couple with children without under 25, couple without children, one parent at least one under 25, one parent without under 25, other types Higher education level: below/equal/above high school diploma Occupation type: Prevalence of: employed, self employed, not in labor age, mixed types Municipal type: Metropolitan cities, metropolitan area, other municipalities <2000, 2000-10000, 10000-50000, >50000 Geographical area (North, Center,South andIslands) Income class: 5 quintiles (€ 11.955, 20.892, 30.028, 46.119) Citizenship (nationality): Italian/Foreign household 3. The assessment of the introduction of the mixed mode Claudia De Vitiis - NTTS, 14th March 2019
3. The assessment of the introduction of the mixed mode • Analysis of total nonresponse bias – R-indicators • R-indicators are based on a measure of the variability of the response propensity and describe how the sample of respondents to a survey reflects the population of interest with respect to certain characteristics • At nationallevelMM sample deviates less from the representative response with respect to the SM sample – MM sample is more representative • * response models defined for each geographical area R-indicators in SM and MM samples Claudia De Vitiis - NTTS, 14th March 2019
4. Estimating mode effects (selection and measurement) • Assessing mode effect in the MM sample using propensity score subclassification • Propensity score subclassification(Rosenbaum and Rubin, 1983) used to disentangle selection and measurement effects, assuming ignorability of selection effect • Propensity score (PS) approach is adopted in observational studies by achieving a balance of covariates between comparison groups, while in MM surveys can be interpreted as the probability of mode assignment conditional on observed covariates • Propensity score model is defined at household level, as the choice of the survey mode depends on household; is a binomial logistic model at household level Survey mode ~ geo area + municipal type + household type + household income class + higher education level + occupation type + citizenship • Calculus of weighs, for each group k defined on the deciles of the propensity score distribution, that equate the weighted proportion of web respondent households with the proportion of PAPI respondent households in the same group Claudia De Vitiis - NTTS, 14th March 2019
Assessing mode effect in the MM sample using propensity score subclassification A global evaluation of mode effects using the weights in the balanced groups (Vandenplas et al, 2016) Selection effect,by the difference between weighted and not weighted estimates on web respondents Measurement effect,measured by the differences between weighted web and not weighted PAPI estimates 4. The estimate of mode effects (selection and measurement) Claudia De Vitiis - NTTS, 14th March 2019
Estimating selection and measurement effects through a benchmark mode To evaluate both selection and measurement effects, has been adopted the instrumental variable approachproposed by Vannieuwenhuyze et al. (2010), in which SM sample (PAPI) is taken as a benchmark, assuming the representativity of the response processes In order to make the SM and MM samples comparable, a calibration procedure is adopted, separately for the two samples, starting from the sampling weights Selection and measurement effect are evaluated on the basis of the probability distributions of the survey categorical variables, estimated from the two comparable respondents’ samples (SM and MM) 4. The estimate of mode effects (selection and measurement) Claudia De Vitiis - NTTS, 14th March 2019
4. The estimate of mode effects (selection and measurement) Selection and measurement effects estimated through different approaches Selection and measurement effects for “reading books in the last 12 months” through instrumental variable approach Selection and measurement effects for “reading books in the last 12 months” in MM respondent’s sample using Propensity Score Claudia De Vitiis - NTTS, 14th March 2019
5. The adjustment of mode effect with different methods • Methods for adjusting selection effect - Weighting methods • Propensity score, calibration of weights modified through the correction factors • Standard calibration on demographic totals • Calibration on fixed levels of mode proportions (method proposed by Buelens and Van den Brakel, 2015), to stabilize the selection effect in repeated surveys, assuming the invariance of measurement effect, with the aim to obtain reliable changes over time • Assuming the hypothesis of ignorability of the selection effect Workshop of the ADVISORY COMMITTEE ON STATISTICAL METHODS, Rome, 19th November 2018
5. The adjustment of mode effect with different methods Adjusting for mode-effect: comparison of the estimates deriving from the application of different methods Methods based on calibrationon distributions of the same socio-demographic totals (age class, sex, educational level) at geographical area level, but different for other aspects: only socio-demographics; socio-demographics and observed fixed levels of mode proportions by six municipal typologies (method proposed by Buelens and Van den Brakel (2015); socio-demographics and hypothesized fixed levels of mode proportions by six municipal typologies; socio-demographics with sampling weights corrected for the web selection effect through correction factors (propensity score) Estimates of “reading books in the last 12 months” variable with different methods Claudia De Vitiis - NTTS, 14th March 2019
6. Final considerations and future developments • For the Aspect of Daily Life survey • the introduction of mixed mode has an important impact both on the composition of the sample (and its representativeness) and on several indicators, whose quality seems to be affected by measurement effect which cannot be always easily assessed. • the application of all the presented methods is subject to the validity of the hypotheses underlying all these methods and that need to be verified by the researcher as far as possible. • what can be highlighted is that the underlying effort is hardly compatible with the usual resources and the timing of a statistical process: only in some cases such a deepening is feasible; in general situations an accurate planning of the data collection phase is more advisable, in order to limit as far as possible ex-ante the measurement effect, which is the main drawback of the mixed mode. • We are aware that from a strictly methodological point of view, the analyses need to taken into account the sampling variability, by means of a simulation to assess significance of the evaluated mode effects Claudia De Vitiis - NTTS, 14th March 2019
Selected references • Buelens, B., and Van den Brakel, J. A. (2015). Measurement error calibration in mixed-mode. Sociological methods & Research, 2015, Vol. 4483) 391-426. • de Leeuw, E. 2005. To mix or not to Mix Data Collection Modes in Surveys. Journal of Official Statistics 21(2), 233-55. • Martin, P. and Lynn, P. (2011). The effects of mixed mode survey designs on simple and complex analyses. Centre for Comparative Social Surveys. Working Paper Series. Paper n.04, November 2011. • Rosenbaum, P. R. and Rubin, D. B. (1983). The Central Role of the Propensity Score in Observational Studies for Causal Effects. Biometrika, Vol. 70, No. 1. (Apr., 1983), pp. 41-55. • Schouten, B., Shlomo, N. and Skinner, C. (2011). Indicators for Monitoring and Improving Representativity of Response. Journal of Official Statistics 27: 231–253. • Vandenplas, C., Loosveldt, G., and Vannieuwenhuyze, J. T. A. (2016). Assessing the use of mode preference as a covariate for the estimation of measurement effects between modes. A sequential mixed mode experiment. Method, data, Analyses. Vol. 10(2), 2016, pp. 119-142. • Vannieuwenhuyze, J. T. A., Loosveldt, G. and Molenberghs, G. (2010). A Method for Evaluating Mode Effects in Mixed-mode Surveys. Public Opinion Quarterly, Volume 74, Issue 5, 1 January 2010, Pages 1027–1045,https://doi.org/10.1093/poq/nfq059 Claudia De Vitiis - NTTS, 14th March 2019