Download
1 / 22
220 likes | 363 Vues
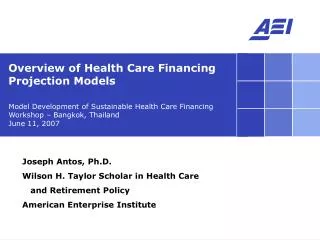
Model Development of Sustainable Health Care Financing Workshop – Bangkok, Thailand June 11, 2007. Overview of Health Care Financing Projection Models. Joseph Antos, Ph.D. Wilson H. Taylor Scholar in Health Care and Retirement Policy American Enterprise Institute. Modeling objectives - I.

E N D
Model Development of Sustainable Health Care FinancingWorkshop – Bangkok, ThailandJune 11, 2007 Overview of Health Care Financing Projection Models Joseph Antos, Ph.D. Wilson H. Taylor Scholar in Health Care and Retirement Policy American Enterprise Institute
Modeling objectives - I • Financial status • Flows of funds – National health accounts • Linkage between Universal Coverage (UC), Civil Service Medical Benefit Scheme (CSMBS), and Social Security Scheme (SSS) • Short-term fiscal capacity • Long-term sustainability Impact of policy or other exogenous changes
Modeling objectives - II • System performance • Participation in Universal Coverage (UC) system • Access to care/benefit coverage • Delivery system adequacy and efficiency • Quality of care • Linkage between UC, CSMBS, and SSS Impact of policy or other exogenous changes
Model types - I • Microsimulation models • “Bottom-up” models • Data on individual units (person, family, firm) • Simulates detailed responses to policy changes • Aggregate models • “Top-down” models • Data on collective units (GDP, total health spending) • Models may be static (constant behavior) or dynamic (behavior changes over time)
Model types - II • Cross-sectional models • Single point in time • Used to identify relationships across subsets of the population (demand elasticities) • Micro or aggregate date • Time-series models • Analysis/prediction of aggregate data over time • Longitudinal models • Cross-sectional analysis over time • Panel data - same units (people, firms) over time • Greater control over unobservable unit-specific variations • Repeated cross-section data – sample is different over time
What constitutes sustainability? • Long-term balance of spending and revenue with • A well-functioning health system • Maintenance of (nearly) universal coverage • Expanded benefits to cover necessary services, new medical technologies, higher demands of a richer and older society • Promotion of adequate and efficient health care delivery • Rewards for quality • Appropriate capital investments (facilities, equipment, management systems) Fiscal and political sustainability are necessary
Modeling fiscal sustainability • Model the major factors driving spending, revenue • Demographics – births, mortality, immigration • Labor force participation • Health status • Health spending per beneficiary • Use simplifying assumptions • Baseline assumption: Current policy • Develop behavioral assumptions on past experience in Thailand—avoid using assumptions from other countries • Structure projections to reduce uncertainty of estimate • Difficult to model L-T impact of changes in policy, exogenous threats to financing (medical technology, epidemic)
A simple model • Spending • Et = ∑ (Pit ∙ Qit) • i • Revenue • Rt = ∑ (Yjt ∙ τjt) • j • where i = enrollee in UC • j = worker in the formal sector • P = price of service • Q = quantity of service • Y = worker income • τ= tax rate
Demographic dangers Development brings lower birth rate, longer life expectancy, increased demands on health system
Key unknown: Health spending/capita • Components of spending growth • Prices of services • Volume of services • Intensity (complexity) of services • Sources of spending growth • Medical progress • Health status of population • Economic growth • Coverage, payment policies of UC
Revenue • “Unsustainable” means revenue<spending necessary to maintain acceptable services • “Acceptability” depends on future circumstances • What is the nature of the social contract? • At one level, revenue difficult to predict • UC does not have a dedicated source of revenue • Dedicated UC fund not a permanent solution • U.S. Medicare operates through trust funds, but is clearly unsustainable at current levels of benefits
Medicare’s long-term fiscal crisis Percent of GDP Projected Total Medicare spending Projected point at which general revenues reach 45% of Medicare outlays HI deficit General revenue transfers State transfers Premiums Tax on benefits Payroll taxes Source: 2006 annual report of the Boards of Trustees of the Medicare trust funds.
Accounting for uncertainty Uncertainty increases with longer projection period, less aggregated fiscal indicator % of GDP CBO, “The Uncertainty of Budget Projections” (2005), http://www.cbo.gov/ftpdocs/61xx/doc6119/02-25-Uncertainty.pdf
Stochastic vs. deterministic approaches • Model to reduce uncertainty • Model health spending/GDP to remove effects of uncertainty in predicting future GDP • Forecast scenarios • High, medium, low trajectory scenarios • Easy to explain, incorporates expert judgment • No probabilistic confidence limits, implicit assumptions are implausible • Stochastic analysis • Assume a probability distribution for each input • Repeated simulations generates distribution of outcomes
Modeling short-term budget impacts • Cost estimates can drive policy • Short-term models can assume stable institutional, behavioral relationships—less uncertainty • Analysis of budget impact often includes distributional impact—to identify which groups are favorably or adversely affected • Analysis may include non-financial measures of system performance (such as changes in the use of services) • Methodological consistency across cost estimates is essential
Budget scoring conventions • Importance of the baseline • “Current law” • Baseline “savings” • Behavioral response • Interactions and unintended consequences • Interactions with other programs (CSMBS, SSS, public health programs) • Unintended consequences caused by structure of capitation payment • Accountability
Case study: Promoting efficiency • Numerous proposals, limited experience • Pay for performance, health information technology • Ideas tried on a limited basis, no clear results • Exaggerated claims based on optimistic studies • Modeling must be analytical, not political • Precisely what is the proposal? How would the policy work? • What are the implementation requirements? • Savings are incremental, improvements beyond what would have occurred without the new policy • Behavioral response—how will the system react? • Will the policy lead to efficiency gains, or must other system changes occur before savings are realized? • What are the unintended consequences?
Modeling informs policymaking • Budget analysis has greater leverage • Cost estimate is tied to a specific policy to resolve a specific problem • Long-term sustainability analysis provides a broader perspective and context, but less specificity • Modeling is stochastic, but policymakers want certainty • Budget process and national health accounts have accounting frameworks, but estimates are stochastic • Failure of policymakers to recognize estimating uncertainty can lead to problems
Improving communication • No single measure of sustainability is sufficient • Gap between spending and revenue in a specific year • Health spending as a % of domestic budget • Discounted present value of funding shortfall • Artificial limits (trust fund insolvency date, limit on certain types of spending • Graphs showing long-term spending and revenue trends • Written narrative may be more important than the number
Case study: Medicare drug benefit • S-T budget analysis dominates L-T analysis • Political focus exclusively on 10-year costs and benefits • 75% of beneficiaries already had coverage • Resources limited in budget window, but unlimited past that horizon • Budget target drove benefit design • $400 B over 10 years • Doughnut hole • Legislated despite huge out-year costs • $8.4 T over 75 years • $17.1 T over infinite horizon • Huge numbers have no meaning to politicians or the public
Practical guidelines - I • Beware of bad data • Invest in data collection (from operations of UC and other schemes, surveys of individuals and firms) • Test model assumptions • Keep current with changes in the health system and the economy • Avoid needless complexity • A more complex model requires better data, more assumptions and may yield less reliable estimates • Tailor presentations to your audience
Practical guidelines - II • Modeling must be objective • An independent entity needed to avoid conflict of interest • Possible locations: MOF, independent office of National Health Security Office, private think tank • Methods must be transparent, data must be publicly available • Modeling must become a normal part of policymaking • “Real time” budget analysis to inform immediate policy decisions—budget rules are important • Long-term modeling (including national health accounts) may be less frequent—changes are more gradual