Color and Absorbance Comparison Summer 2009
140 likes | 271 Vues
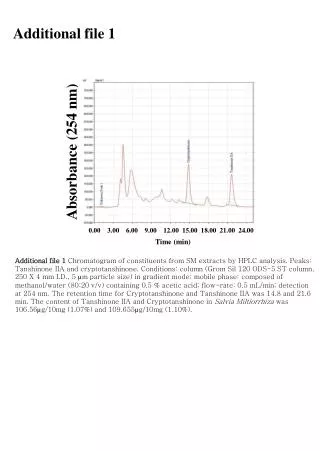
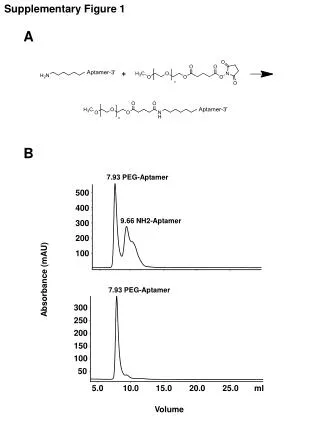
This study examines color and absorbance measurements using a Perkin Elmer spectrophotometer with a 1 cm path length. It details the procedures of filtering samples with 0.45 and 0.22 μm cellulose filters and centrifuging for 30 minutes. The absorbance values are recorded at wavelengths of 345 nm and 440 nm, accounting for various dilutions. The effects of filtration and centrifugation on color values are also compared, providing insights into the optical properties of the samples under examination.

Color and Absorbance Comparison Summer 2009
E N D
Presentation Transcript
Color and Absorbance Comparison Summer 2009
Perkin Elmer Spectrophotometer • 1 cm path length • 345 & 440 nm wavelenghts • Filtered with 0.45 & 0.22 um cellulose filters • Centrifuged for 30 minutes • Dilutions accounted for in all values
Color Values Filtered 0.45 @ 440 Filtered 0.22 @ 440 110 % 100% Centrifuged @ 345 10% Filtered 0.45 @ 345
Absorbance Values Centrifuged @ 345 10% Filtered 0.45 @ 345 510 % 500% Filtered 0.22 @ 440 Filtered 0.45 @ 440