Absorbance spectroscopy
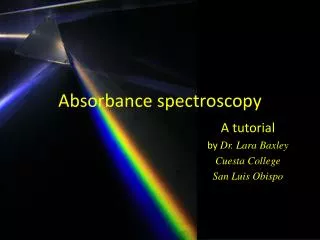
Absorbance spectroscopy. A tutorial by Dr. Lara Baxley Cuesta College San Luis Obispo. Introduction to this tutorial. This is a self-paced tutorial about absorbance spectroscopy. Click your mouse or down arrow key to reveal each part.

Absorbance spectroscopy
E N D
Presentation Transcript
Absorbance spectroscopy A tutorial by Dr. Lara Baxley Cuesta College San Luis Obispo
Introduction to this tutorial • This is a self-paced tutorial about absorbance spectroscopy. • Click your mouse or down arrow key to reveal each part. • If the tutorial asks a question, you should answer it either in your head or write down your answer before advancing (have a calculator handy). • Take notes on this material; you will need it to complete your prelab and lab calculations.
Question: What makes a solution appear a certain color? • Answer: a solution will appear acertain color if it absorbs the complementary color (the opposite color in the color wheel).
The Color Wheel For example: If a solution appearsred, this means that it is primarily absorbinggreen. Sample absorbs green, but transmits all other colors White light containing all colors shines on the sample Eye sees the remaining combination of colors as red
A Spectrophotometer A spectrophotometer measures the amount of light absorbed by a sample. Here’s how it works: 3. A diffraction grating separates the colors of light 5. Light passes through the sample 1. A light bulb emits white light 2. Light passes through a slit to form a narrow beam 4. Another slit allows just one color to pass 6. A detector measures the final amount of light
Absorbance Absorbance, A, is a measure of how much light is absorbed. Absorbance does not have units. The less light that gets through, the greater the absorbance.
Percent Transmittance Another measurement that is related to absorbance is % transmittance. Percent Transmittance, %T, is a measure of how much light passes through a sample. Question: If light passes through water, what will be the %T? Answer: all light will pass through, so the transmittance is 100%.
Relationship of A and %T Absorbance and % transmittance are mathematically related through the following equation. %T A = –log 100 Example: Calculate the A if %T = 56.5%. Answer: A = –log(0.565) = 0.248 Notice that the higher the %T, the lower the A, but the relationship is not linear.
Absorbance spectrum The absorbance spectrum is a graph of the absorbance of a solution at different wavelengths. An absorbance spectrum might look something like this: Notice that there is a peak at 600 nm. What color would you expect this solution to be? Since the solution is absorbing orange, it must appear blue, which is complementary to orange.
lmax The wavelength of maximum absorbance is called lmax. For best accuracy, when measuring the absorbance of several solutions, it is best to measure as close to lmax as possible.
A Colorimeter The Vernier Colorimeters used at Cuesta College are different from spectrophotometers. A colorimeter uses LED lights that emit specific wavelengths. This means that a colorimeter can only measure absorbance at these specific wavelengths. With a colorimeter, the wavelength closest to lmax is usually selected. 635 nm 565 nm 470 nm 430 nm
Using a Colorimeter A colorimeter contains the LEDs, a sample holder, and a detector. The sample goes in the sample holder. Select the best wavelength. For this sample, the best wavelength is 470 nm. 635 nm 565 nm 470 nm 430 nm LEDs detector sample holder
Using a Colorimeter Question: What would happen if the wrong wavelength were selected? If the wrong wavelength is selectedthere will be little to no absorbance. All four wavelengths could be tested (one at a time) to determine the maximum absorbance. 635 nm 565 nm 470 nm 430 nm LEDs detector sample holder
Concentration and Absorbance Which of these two solutions contains a higher concentration of red dye? Did you answer solution A? If so, you are correct!A higher concentration leads to a darker color.
Concentration and Absorbance Which of these two solutions will have a higher absorbance at lmax? Did you answer solution A again? That’s right! The higher the concentration, the greater the absorbance.
Beer’s Law The mathematical relationship between concentration and absorbance is called Beer’s Law. It looks like this: A = ebc The parts of the equation are: A = absorbance • = molar absorptivity (constant for a given solute at a given wavelength) • b = width of the tube holding the sample (1.00 cm in our lab) • c = molar concentration (mol/L) b = 1.00 cm
Beer’s Law A = ebc In the above equation, which parts are constant, and which are variable? e and b are constants (under the correct conditions), A and c are variables. This equation is rarely used in this form. Instead, the data is typically graphed and the data fit to a best-fit line. The next few slides will show how this works.
Beer’s Law A = ebc Imagine that you tested the absorbance of the 5 solutions shown below: What trend do you predict for their relative absorbance readings at lmax?
Beer’s Law A = ebc The actual absorbance readings are shown here: Look at this data and look at Beer’s law.What variables would you graph in order to make the data fit a straight line (y = mx + b)? y = mx + b
Beer’s Law Graph A = ebc A c y= m x + b If you were to graph this data, what variable would you graph on the y-axis? Absorbance, because it’s the dependentvariable(it’s also on the left of the equals sign). What would you graph on the x-axis? Concentration, because it’s the independent variable (it’s also on the right of the equals sign). Let’s see how this works…
Beer’s Law Graph A = ebc A c y= m x + b
Beer’s Law Graph A = ebc Here is an actual graph of this data. This is also called a calibration graph because it is made using known values and can be used to determine an unknown. Example: If an unknown solution has an absorbance of 0.351, what is its concentration? (calculate this before you click!) 0.351 = 4.806x – 0.0002 x = c = 0.0731 M
Beer’s Law Graph A = ebc Using the graph, calculate the molar absorptivity of this substance, including units. Hint: Remember that b = 1.00 cm Looking at the equation above, m = eb, therefore, y= m x + b m 4.806 M-1 e = = = 4.806 M-1cm-1 b 1.00 cm
Beer’s Law Graph A = ebc How do you figure out the units of the slope? Slope = rise/run or Dy/Dx Therefore, the units of the slope are the (y-axis units)/(x-axis units) It is important to remember that A does not have units. y= m x + b
Conclusion Now that you have completed this tutorial you should be able to, • Predict the relationship between a solution’s color and the wavelength of light it absorbs. • Understand how spectrophotometers and colorimeters measure the absorbance of a solution. • Create a calibration graph and use it to determine the concentration of an unknown solution.