SPECTROSCOPY
SPECTROSCOPY. Kendall Olds Derrick Woods Ricketta Johnson Carl Flowers. Definition of Spectroscopy. The study of how the chemical compound interacts with different wavelengths in a given region of electromagnetic radiation is called spectrochemical analysis .

SPECTROSCOPY
E N D
Presentation Transcript
Kendall Olds • Derrick Woods • Ricketta Johnson • Carl Flowers
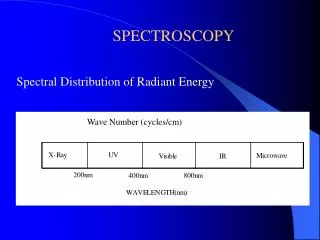
Definition of Spectroscopy The study of how the chemical compound interacts with different wavelengths in a given region of electromagnetic radiation is called spectrochemical analysis.
Spectrophotometry What is it???? • The process of measuring light intensities with a spectrophotometer.
SpectrophotometerWhat is it???? • A spectrophotometer is a photometer (a device for measuring light intensity) that can measure intensity as a function of the color, or more specifically, the wavelength of light.
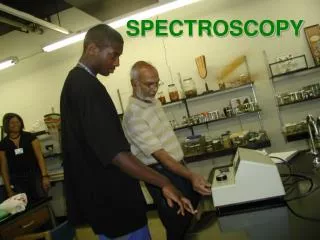
How to use a spectrophotometer • Turn the spectrophotometer on at least 10 minutes before using. • Set the wavelength desired using the knob (upper right-hand). • With the chamber empty and closed, adjust the machine to read 0% using the front left-hand knob.
How to use a spectrophotometer • Insert a clean sample tube containing at least 3 ml of distilled water into the chamber. The outside of the sample tube must be wiped clean using a Kleenex tissue because fingerprints will be read by the machine. • Adjust the absorbance to 0 using the front right-hand knob. • Insert a clean sample tube containing the light absorbing sample (at least 3 ml.). Read the absorbance.
The Procedure • First we made a series of solutions of known concentration of methylene blue. • We set the mode of the spec 20(spectrometer) to absorption and set the wave length to 668. • We then measured the absorption of the standard solution from low concentration to the highest concentration.
TheProcedure 4. Each time we took a reading we set the absorption to zero setting with the distilled water. 5. We then recorded the absorption of the unknown solution. 6. Then we constructed a standard curve using the data from the know solution. 7. From the standard curve we estimated the strength of the unknown solution.
Standard Curve for Methylene Blue Demonstration From Dr. Uddin Results From Students
Regression Analysis from Dr. Uddin’s Experiment R Square is closed to 1, so it is a good of fit for a linear regression The regression line is % of concentration = 2.199 * absorption – 0.082 When the absorption is 0.165, the unknown of concentration is 2.199 * 0.165 – 0.082, which is 0.2785.
Regression Analysis from Students’ Experiment R Square is closed to 1, so it is a good of fit for a linear regression The regression line is % of concentration = 1.888 * absorption – 0.082 When the absorption is 0.13, the unknown of concentration is 1.888 * 0.13 – 0.082, which is 0.1629.
Spectrophotometric Determination & Protein Concentrations It is good of fit. The regression line is % of concentration = 0.977 * absorption – 0.808 When the absorption is 1.08, the unknown of concentration is 0.977 * 1.08 – 0.808. which is 0.247.
Conclusion From this project, we learn the way to use a spectrophotometer and collect the data from the biology lab. After that we do the regression analysis from the statistics class. The results show well and the unknown concentrations have been found.
This Concludes Our Presentation We thank TLSAMP, Dr. Uddin, and Dr. Chu for helping and supporting us with this project. • Kendall Olds • Derrick Woods • Ricketta Johnson • Carl Flowers