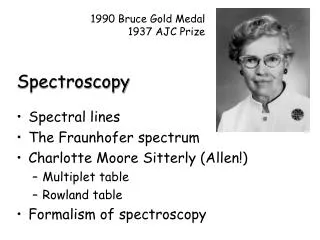
Spectroscopy
Spectroscopy, Diffusometry and Imaging of Confined Systems Performed by Nuclear Magnetic Resonance. Dieter Freude, Institut für Experimentelle Physik I der Universität Leipzig Regional Annual Fundamental Science Seminar 2008, 28 May 2008. Spectroscopy.

Spectroscopy
E N D
Presentation Transcript
Spectroscopy, Diffusometry and Imaging of Confined Systems Performed by Nuclear Magnetic Resonance • Dieter Freude, Institut für Experimentelle Physik I der Universität Leipzig Regional Annual Fundamental Science Seminar 2008, 28 May 2008
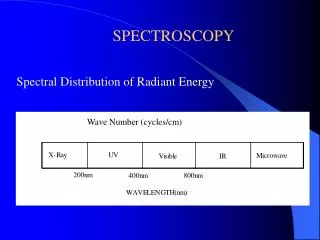
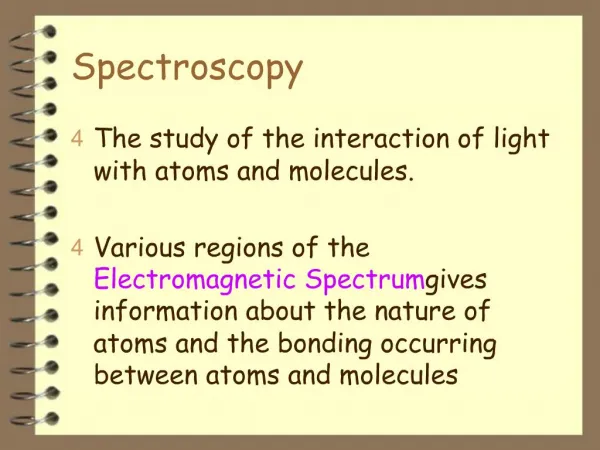
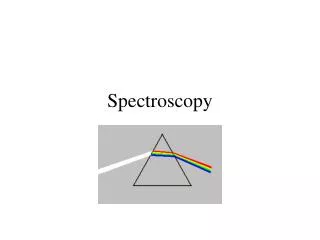
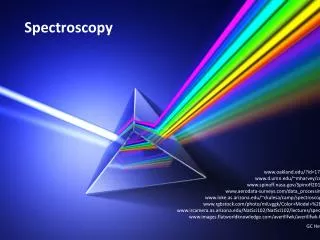
Spectroscopy In the year 1666 at Cambridge, Isaac Newton procured a triangular glass prism and let a ray of sunlight from a small round hole in the window illuminate it. He observed the image created thereby on a paper screen. The white light from the window dispersed into red, yellow, green, blue, and violet. He called the colors, invisible in the white sunlight, the “spectrum” (lat. spectrum = image in the soul). In 1882 Arthur Schuster first used the term spectroscopy during a lecture at the Royal Institution. This word has both a Latin and Greek root (Greek skopein = to look). I. Newton: handwriting from 6. 2. 1672 at the Royal Society. In an accompanying letter is the discovery of the dispersion of sunlight dated 1666. A. Schuster in Encyclopedia Britannica (1911 ed.).
Spectroscopy In the year 1861 the physicist Gustav Robert Kirchhoff (left) and the chemist Robert Wilhelm Bunsen (right) published a paper “Chemical Analysis through Spectral Observations”. The physicist, astronomer and optician Carl August von Steinheil manufactured the used spectroscope. This was the begin for the wide application of spectroscopy in science and technology. G. Kirchhoff und R. Bunsen, Poggendorff's Ann. der Physik und Chemie 60 (1860) 161 und 63 (1861) 337.
NMR spectroscopy In the year 1945 nuclear magnetic resonance (NMR) was introduced almost simultaneously in Boston by Edward Mills Purcell (at left) and in Stanford by Felix Bloch (at right). Figure 6 from E. M. Purcell: Research in Nuclear Magnetism, Nobel Lecture, December 11, 1952 and figure at right: www.bruker-biospin.com/natural_products.html Right hand side, a spectrum measured in the current century with a cryogenic probe : Two dimensional spectrum of a natural pharmaceutical. Cross peaks in the 13C-1H spectrum show connectivities in the material.
NMR diffusometry • NMR provides a simple and direct method for measuring self-diffusion coefficients down to about 10–14 m2s-1. • The species under study is likely to be a molecule or ion. • NMR diffusometry does not require labeling and is effectively non-invasive. • For literature see: www.diffusion-fundamentals.org Einstein‘s relation Note that NMR diffusometry is fewer applied than NMR spectroscopy.Google counts 1 650 000 records for the latter, but only 2 560 for NMR diffusometry. Propagator description
Hahn echo p/2 pulseFID, p pulse around the dephasing around the rephasing echo y-axisx-magnetizationx-axisx-magnetization a(r,t) = Dw(r)·t a(r,t) = -a(r,t) + Dw(r)·(t -t)
High-resolution solid-state MAS NMR Fast rotation (1-60 kHz) of the sample about an axis oriented at 54.7° (magic-angle) with respect to the static magnetic field removes all broadening effects with an angular dependency of rotor with sample in the rf coil zr B0 rot θ That means chemical shift anisotropy,dipolar interactions,first-order quadrupole interactions, and inhomogeneities of the magnetic susceptibility. It results an enhancement in spectral resolution by line narrowing also for soft matter studies. gradient coils forMAS PFG NMR
rotor with sample in the rf coil zr B0 rot θm CH (iso) 3 CH (n - but) 3 gradient coil p/2 p p/2 p/2 p p/2 p/2 g gradient pulses = 0.4 ppm δ rf pulses Δ but) CH (n - 2 ωr = 0 kHz CH (iso) FID r. f. ωr = 1 kHz * * * * * * gradient 4 2 0 -2 t t t t d / ppm strength g g pulses δ = 0.02 ppm Gz ωr = 10 kHz d d FAU Na-X , n-butane + isobutane 2.0 1.5 1.0 0.5 d / ppm t T ecd D 1.0 2.0 d / ppm Δδ MAS PFG NMR for NMR diffusometry
Magnetic resonance imaging SIEMENS 7-Tesla-Scanner Grand Opening for 7 T MRI Laboratory, 18-19 January 2008 The Max Planck Institute for Human Cognitive and Brain Sciences Leipzig celebrated the Opening of the new Seven Tesla Magnetic Resonance Imaging Laboratory. The now achievable spatial resolution of 0.4 mm, allows researchers to traces brain changes over time – such as those during music training – much more precisely. Note that whole body scanners with a magnetic field strength of 7 T or above are not certified as a medical device for human use. Therefore, it is for probands, not for patients.
Imaging by pulsed gradients E describes in the figure above the development, in which Gx was chosen to be negative and Gy positive. N is the detection path, in which Gy = 0 and Gx is positive. rf pulses, gradient pulses and the time signal are shown in the figure at left.
Blood oxygenation level dependent (BOLD)contrast in fMRI studies Functional magnetic resonance imaging (fMRI) of the human brain is usually based on measuring local changes in blood oxygenation. Hemoglobin is diamagnetic when oxygenated but paramagnetic when deoxygenated. The blood oxygenation level dependent (BOLD) contrast is a consequence of neuronal activation in the brain. The paramagnetic deoxyhemoglobin causes changes in magnetic susceptibility of blood. It is closely related to oxygen delivery and consumption and expected to correlate with neuronal activity. The BOLD contrast reflects the imbalance between the local oxygen demand and delivery. But BOLD contrast can be problematic since the contrast reflects changes in blood oxygenation which can be distant from the activated site, e.g. in the presence of large veins. In the work cited below, a novel approach is presented to increase specificity, i.e. to confine the origin of the BOLD contrast to the microvasculature, by predicting the average venous vessel radius in activated voxels, and to filter out those voxels whose contrast is dominated by large veins. Thies H. Jochimsen and Harald E. Möller: Increasing specificity in functional magnetic resonance imaging by estimation of vessel size based on changes in blood oxygenation, NeuroImage 40 (2008) 228–236
Filtering out voxels whose contrast is dominated by large veins Maps of the average blood vessel radius of activated voxels (volumetric pixel) overlaid on T1-weighted images. Values are color-coded by the logarithm of the average vessel size, ranging from 1 to 100 μm. The top map shows the activation pattern with all voxels included. In the bottom map, all activated voxels withr > 30 μm are removed from the pattern. Thies H. Jochimsen and Harald E. Möller: NeuroImage 40 (2008) 228–236
Diffusion-weighted imaging (DWI) and functional magnetic resonance imaging (fMRI) preSMA: presupplementary motor area IFC: inferior frontal cortex STN: subthalamic nucleus Diffusion-weighted tractography results. A, 3-D rendering of the tracts between the right IFC, the right preSMA, and the right STN region. B, Triangulation method for determining the third point in a network from the other two. Tracts originating in one brain area are overlaid on tracts originating from another. The overlap is superimposed on a gray matter mask in standard space. http://dericbownds.net/uploaded_images/aron.pdf Adam R. Aron, Tim E. Behrens, Steve Smith, Michael J. Frank, and Russell A. Poldrack: Triangulating a Cognitive Control Network Using Diffusion-Weighted Magnetic Resonance Imaging (MRI) and Functional MRI, The Journal of Neuroscience, April 4, 2007 • 27(14):3743–3752 • 3743
MAS PFG NMR studies of the self-diffusion of acetone-alkane mixtures in nanoporous silica gel The self-diffusion coefficients of mixtures of acetone with several alkanes were studied by means of magic-angle spinning pulsed field gradient nuclear magnetic resonance (MAS PFG NMR). Silica gels with different nanopore sizes at ca. 4 and 10 nm and a pore surface modified with trimethylsilyl groups were provided by Takahashi et al. (1). The silica gel was loaded with acetone –alkane mixtures (1:10). The self-diffusion coefficients of acetone in the small pores (4 nm) shows a zigzag effect depending on odd or even numbers of carbon atoms of the alkane solvent. Fig. 3. Pore size distribution of the specimens of nanoporous silica gel Nm () andB1m () used in the diffusion measurements. Moises Fernandez, André Pampel, Ryoji Takahashi, Satoshi Sato, Dieter Freude, Jörg Kärger;Phys. Chem. Chem. Phys., in print
octane CH2 CH3 acetone CH3 gradient strength 2.8 2.4 2.0 1.6 1.2 0.8 0.4 d / ppm Stack plot of the 1H MAS PFG NMR spectra at 10 kHz of the 1:10 acetone and octane mixture absorbed in Em material as function of increasing pulsed gradient strength for a diffusion time D = 600 ms: Semi-logarithmic plot of the decay of the CH3 signal of ketone in binary mixture with acetone at 298 K. The diffusion time isD = 600 ms and a gradient pulse length is d = 2 ms: The diffusivities of acetone dissolved in odd-carbon number n-alkanes exceed those of acetone dissolved in even-carbon number n‑alkanes by about 50%.This finding shows the odd-even zig-zag effect and suggests the formation of acetone – n‑alkane complex-like assemblages in the narrow-pore silica gel.
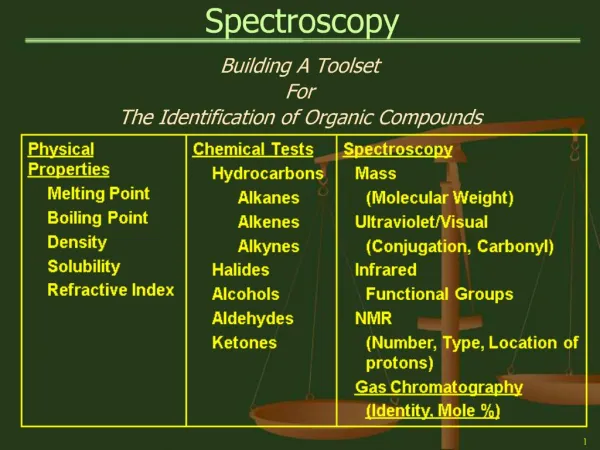
In situ monitoring of catalytic conversion of molecules in zeolites by 1H, 2H and 13C MAS NMR 13C CP/MAS NMR spectra of [2-13C]-n-but-1-ene adsorption on H-FER in dependence on reaction time. Asterisks denote spinning side-bands.The appearance of the signals at 13 and 17 ppm and decreasing intensity of the signal at 126 ppm show the label scrambling. 2H MAS NMR spectra of n-but-1-ene-d8 adsorbed on H‑FER (T = 333K). n-But-1-ene undergoes readily a double-bond-shift reaction, when it is adsorbed on ferrierite. The reaction becomes slow enough to observe the kinetics , if the catalyst contains only a very small concentration of Brønsted acid sites. 1H MAS NMR spectra of n-but-1-ene-d8 adsorbed on H-FER2 (T=360K). Hydrogen transfer occurs from the acidic hydroxyl groups of the zeolite to the deuterated butene molecules. Both methyl and methene groups of but-2-ene are involved in the H/D exchange. The ratio between the intensities of the CH3 and CH groups in the final spectrum is 3:1. Kinetics of a double-bond-shift reaction, hydrogen exchange and 13C-label scrambling of n-butene in H-ferrierite A.G. Stepanov, S.S. Arzumanov, M. V. Luzkin, H. Ernst, D. Freude: In situ monitoring of n-butene conversion on H-ferrierite by 1H, 2H and 13C MAS NMR, J. Catal. 229 (2005) 243-251.
I acknowledge support from Ministry of Science, Technology and Innovationin the frame of the Brain Gain Malaysia Programme Academy of Sciences Malaysia Ibnu Sina Institute for Fundamental Science Studiesat Universiti Teknologi Malaysia Terima kasih