1 / 3

EXAMPLE 1

Order: the data. Then find the median and the quartiles. EXAMPLE 1. Make a box-and-whisker plot. SONG LENGTHS. The lengths of songs (in seconds) on a CD are listed below. Make a box-and-whisker plot of the song lengths. 173, 206, 179, 257, 198, 251, 239, 246, 295, 181, 261. SOLUTION.

hieu
Télécharger la présentation

EXAMPLE 1

An Image/Link below is provided (as is) to download presentation Download Policy: Content on the Website is provided to you AS IS for your information and personal use and may not be sold / licensed / shared on other websites without getting consent from its author. Content is provided to you AS IS for your information and personal use only. Download presentation by click this link. While downloading, if for some reason you are not able to download a presentation, the publisher may have deleted the file from their server. During download, if you can't get a presentation, the file might be deleted by the publisher.

E N D

Presentation Transcript


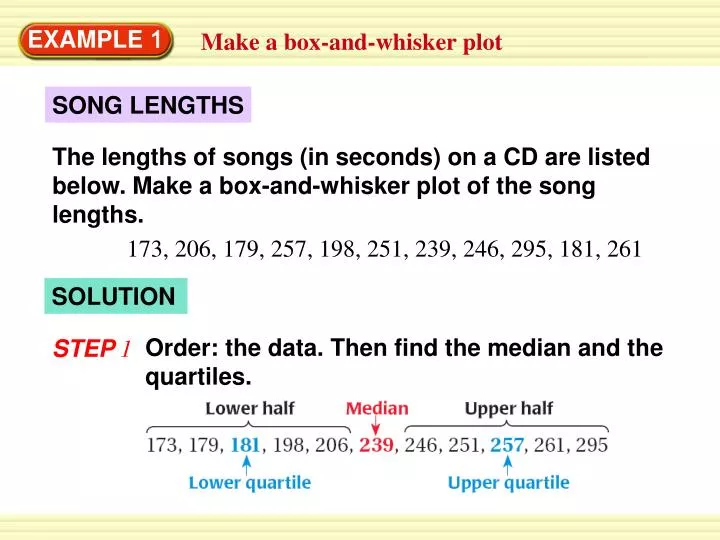
  1. Order: the data. Then find the median and the quartiles. EXAMPLE 1 Make a box-and-whisker plot SONG LENGTHS The lengths of songs (in seconds) on a CD are listed below. Make a box-and-whisker plot of the song lengths. 173, 206, 179, 257, 198, 251, 239, 246, 295, 181, 261 SOLUTION STEP 1

  2. Plot the median, the quartiles, the maximum value, and the minimum value below a number line. EXAMPLE 1 Make a box-and-whisker plot STEP 2 STEP 3 Draw a box from the lower quartile to the upper quartile. Draw a vertical line through the median. Draw a line segment (a “whisker”) from the box to the maximum and another from the box to the minimum.

  3. ANSWER . . . . 15 30 45 60 75 15 22.5 35 57.5 70 for Example 1 GUIDED PRACTICE 1.Make a box-and-whisker plot of the ages of eight family members: 60, 15, 25, 20, 55, 70, 40, 30.

More Related