Download
1 / 7
70 likes | 200 Vues
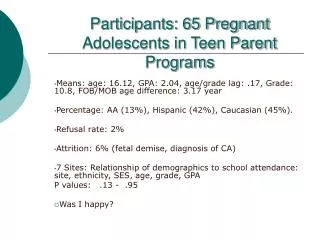
Participants: 65 Pregnant Adolescents in Teen Parent Programs. Means: age: 16.12, GPA: 2.04, age/grade lag: .17, Grade: 10.8, FOB/MOB age difference: 3.17 year Percentage: AA (13%), Hispanic (42%), Caucasian (45%). Refusal rate: 2% Attrition: 6% (fetal demise, diagnosis of CA)

E N D
Participants: 65 Pregnant Adolescents in Teen Parent Programs Means: age: 16.12, GPA: 2.04, age/grade lag: .17, Grade: 10.8, FOB/MOB age difference: 3.17 year Percentage: AA (13%), Hispanic (42%), Caucasian (45%). Refusal rate: 2% Attrition: 6% (fetal demise, diagnosis of CA) 7 Sites: Relationship of demographics to school attendance: site, ethnicity, SES, age, grade, GPA P values: .13 - .95 Was I happy?
Statistical tests: Were the right ones used? Demographics: 7 groups: ANOVA used.. not 42 T-Tests Linear Regression: Not single order correlations DV: school attendance: interval data: 1-21 days. Variables entered into the computer in a step-wise manner based on the TPB: 1st: Demographics then TPB concepts
DV: C = School attendance: IV: A= Attitude: r = AC + ABC R2= ACbeta = ACIV: B= Social Norm r = BC+ABC beta= BC
Did the theory (model) work? How do you know?Why are the R2 and Adjusted R2 different (think sample size!)
Does the TBP help us understand school attendance? IVs: Demographics: Did not predict school attendance: P = .28 - .62 IVs: Attitude + Social Norm + Perceived Control + Intention Predicted DV: School Attendance Why is this a helpful thing to know?