Download

1 / 17
170 likes | 424 Vues
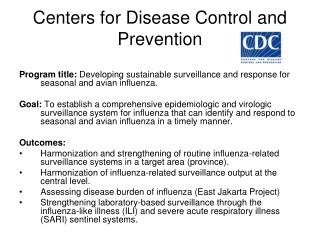
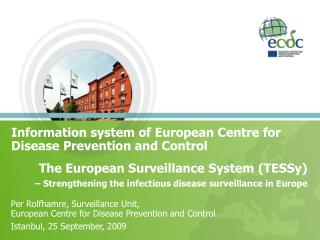
EMMA : ECDC Mapping and Multilayer Analysis A GIS enterprise solution to EU agency. Sharing experience and learning from the others Lorenzo De Simone, GIS Expert/ EMMA Project Manager GIS Workshop, 17 June Aarlborg 2014. ECDC is the European Center for Disease Prevention and Control.

E N D
EMMA : ECDC Mapping and Multilayer AnalysisA GIS enterprise solution to EU agency.Sharing experience and learning from the othersLorenzo De Simone, GIS Expert/ EMMA Project Manager GIS Workshop, 17 June Aarlborg 2014
ECDC is the European Center for Disease Prevention and Control. Established in 2005 by the European Parliament, the ECDC is the European Centre for disease Control and Prevention. ECDC’s mandate is to protect European Citizen’s health against emerging threats and to support the EU Member States work in the field of Surveillance, Outbreak Response and Scientific Advice. GIS has been identified by the organization as a strategic cross sectional activity that can greatly support the daily work and also long term objectives. Experts within the ECDC and Member States need to have timely access to disease maps, to combine accurate, consistent disease data with other geographic information, and to identify patterns in disease spatial data in order to protect and improve European public health. In line with this vision, ECDC has first released in March 2013 EMMA, the ECDC Mapping and Multilayer Analysis system.
Why EMMA? • What does ECDC want from GIS first of all? • Visualization and disease tracking • Holistic approach to data analysis • Interoperability between systems, tools, data • Sharing of disease data • Definition of standards for disease mapping • Challenges • Silos data structure • GIS projects carried out individually (departmental GIS) • Limited number of GIS software licenses and staff • Limited capacity to retrieve / consume spatial data from other sources
What is EMMA? ECDC Mapping and Multilayer Analysis:Enterprise solution for ECDC for disease mapping and analysis and sharing. • 2 components: • Back end: enterprise data, geoprocessing services, map services, procedures and standards • Front end: webgis client • Add to map disease data from local file or connect to ECDC disease repositories • Connect to other GIS data providers (e.g. EEA/ESRI,etc) and to Eurostat data • Customized analysis tools to deal with case based and aggregated disease data • 4) Export maps to corporate layouts and sharw;
What is EMMA? ECDC Mapping and Multilayer Analysis:Enterprise solution for ECDC for disease mapping and analysis and sharing • 2 components: • Back end: enterprise data, geoprocessing services, map services, procedures and standards • Front end: webgis client • Add to map disease data from local file or connect to ECDC disease repositories • Connect to other GIS data providers (e.g. EEA/ESRI,etc) and to Eurostat data • Customized analysis tools to deal with case based and aggregated disease data • 4) Export maps to corporate layouts and sharw;
1) Add your disease data to the map – system geocodes by NUTS and GAUL codes (ecdc geocoding service) 1 Select CSV from local pc 5 Output map!! Upload and configure using the CSV import tool: 2 • Define specific Geo-field and import only fields of interest from your dataset • Aggregate case based data by Summarizing the entries from your dataset • Choose the map geometry to fit your mapping needs – polygons or points 3 Define layout and fine edits and save map using Export tool 4 Define symbology and Classification methods using the Legend editor tool • Define class breaks using 4 predefined algorithms or manual configuration • Selectcolor ramps to better symbolize your map • Edit legend aliases • Manage null values
2) Join population data from EUROSTAT CSV input data is uploaded containing only cases numbers 1 2 Upload and configure using the CSV import tool: • Disease data from CSV • Population data is joined: age groups are defined as AER age groups for geographic areas NUTS 0-2 level (source Eurostat 2011) population per age group is automatically calculated and joined to the uploaded data. 2
Add data from EEA Users can add multiple spatial layers to their map accessing preselected and standardised spatial dataset from the central ECDC repository and/or from other GIS sources: access is easily centralised in the browse data panel • Sample disease data: e.g. Respiratory Tract Infection 1 • Browse for spatial data Select GIS Server and Layer: e.g. EEA , NOX emissions from diffuse industrial emissions 2 3 • Output map: disease data and industrial emissions 4
4) Publish map Geo-Gallery The Geo Gallery section allows ECDC experts to to store, share and distribute cartographic outputs if needed; • Users can upload map and add a brief description of the map, a title and specify their section. This will facilitate the systematic retrieval of the map. • Users can search for maps and download them • GIS team follows up with map approval internally in the system
5) Get GIS training data and instructions GIS documents Module: for discovering good practices of spatial analysis in epidemiology and access training data and material. In 2013 ECDC has provided EMMA training to Experts and EPIET fellows.2
6) Other ECDC web-gis clients benefiting from the GIS Service Oriented Architecture (SOA) of EMMA. ECDC GIS Clients epidemiological and microbiological information about food- and waterborne diseases events. Ecdc Measles Atlas This atlas has been prepared by the GIS team in collaboration with the Vaccine Preventable Disease team to monitor the progress of the ECDC’s priority to “advance measles elimination.” The atlas is hosted in an ArcGIS - Silverlight viewer and consumes a series of map services provided by the EMMA back-end that cover four series of maps showing vaccination coverage and incidence rates of measles in Europe between 2006 and 2012. The application is accessible to the public at http://emmageocase.ecdc.europa.eu/atlas/MEASLES/ Not sure what this means? By priority do you mean the ECDC initiative or goal to “advance measles elimination.”
EMMA RESULTS: Provide Experts in ECDC in the EUMember States, EU Commission with a full integrated GIS system, free of licence costs, that can be used to produce disease maps, and access and share spatially enabled data on European health/environment/socio economics etc. Seamless integration with other EU agency GIS system in support of the holistic approach to health/environment data analysis Increase Agency productivity in GIS outputs by shifting the departmental model to enterprise and now from file centered to web-centerd.
GIS workflows, methods, tools, procedures. How much similar or different are the EU agencies in GIS needs ? How much are / can we be similar in solution? Example EEA and ECDC Spatial data collection Spatial data production Spatial data analysis Spatial data sharing Development of webgis applications and specific geoprocessing tools Public audience and trusted users High demand from stakeholders, small team
Distributed editing and centralised management in EEA. A very efficient and smart example
Distributed editing and centralised management in ECDC. Extending further in line with EEA model Intranet/DMZ
Benefits of sharing GIS strategies in EU agencies • Lessons learnt on the key aspect of gis implementation e.g. identification of requirements, workflow design and QA/QC, interoperability of systems, sharing and data security etc. • Better integration between ICT and Business side in EU agencies • Smaller learning curve for new teams • High productivity, lower costs
Thank you! • Lorenzo De Simone, • ECDC GIS Expert/ EMMA Project Manager • Email Contact: Lorenzo.desimone@ecdc.europa.eu