1 / 15

Graphical Interpretation of the Inverse of a Function

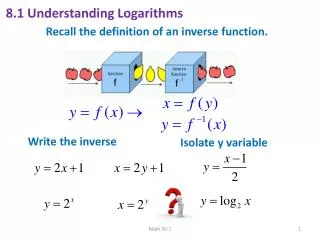
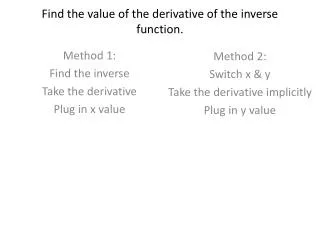
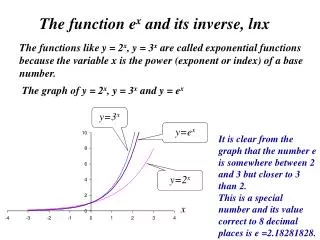
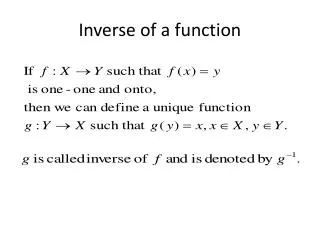
This article explores the graphical interpretation of inverse functions, illustrating key concepts and examples. A function f is invertible if, and only if, it is both one-to-one and onto. We specifically examine the sine function, f(x) = sin(x), through graphical representation to understand its inverse. By visualizing the function and its inverse, we can better grasp the relationship between them, reinforcing the significance of these properties in determining the invertibility of functions.

Télécharger la présentation

Graphical Interpretation of the Inverse of a Function

An Image/Link below is provided (as is) to download presentation Download Policy: Content on the Website is provided to you AS IS for your information and personal use and may not be sold / licensed / shared on other websites without getting consent from its author. Content is provided to you AS IS for your information and personal use only. Download presentation by click this link. While downloading, if for some reason you are not able to download a presentation, the publisher may have deleted the file from their server. During download, if you can't get a presentation, the file might be deleted by the publisher.

E N D

More Related