Enhancing Sustainability through Efficient Resource Management and Process Improvement
150 likes | 319 Vues
This guide explores the critical frameworks for sustainability in product development and process management. It delves into the transformation processes of inputs to outputs, assesses water usage efficiencies, and highlights non-value-added activities that can hinder effectiveness. Various metrics are discussed, including environmental impacts, reuse, durability, and energy consumption. Insights into customer needs and engineering metrics are provided, promoting eco-friendly practices and life cycle analysis for a comprehensive understanding of the environmental and operational challenges in product design.

Enhancing Sustainability through Efficient Resource Management and Process Improvement
E N D
Presentation Transcript
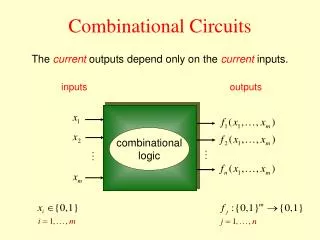
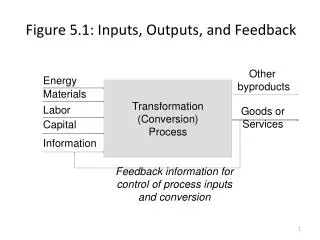
Energy Materials Labor Goods or Services Capital Information Feedback information for control of process inputs and conversion Figure 5.1: Inputs, Outputs, and Feedback Other byproducts Transformation (Conversion) Process
Figure 5.4 Water Used vs Needed Summary of Water Waste Water Used: 95,000 gallons Actual Water Needed: 50,000 gallons Water Wasted: 45,000 gallons Water Used 30 Kgal 15 Kgal 45 Kgal 5 Kgal 0 Kgal 10 Kgal 5 Kgal 30 Kgal 5 Kgal 0 Kgal Actual Water Needed
Figure 5.6 Typical causes of Non-value added activities Problems with Products/Design Waste observed within the process Problems with Metrics Problems with Process Problems with Customers/Mix
Figure 5.12 Cradle to Cradle Philosophy Biological Technical
Table 5.3 Sample of Environmental Needs and Engineering Metrics Environmental Needs Environmental Engineering Metrics Weight Volume Number of parts Variety of materials Likelihood of getting dirty or oxidizing Hardness Physical lifetime Energy consumption Rate of recycled material Sensory impact (noise, visual, etc.) Emissions mass (air, water, soil) Biodegradability Material Toxicity • Less material usage • Less energy & water consumption • Easy to transport and store • Easy to process and assemble • High durability • Easy to reuse • Easy to disassemble & sort • Easy to maintain • Easy to compact • Safe to incinerate • Easy to dispose of or safe to landfill • Harmless to biosphere • Safe emissions