Download

1 / 22
220 likes | 390 Vues
Outputs, Inputs and Productivity in the NHS. Mary O’Mahony presentation to the 4th NIESR Public Service Performance Conference Friday 20th January 2006. Summary of Report funded by Department of Health. ‘Developing new approaches to measuring NHS outputs and productivity’

E N D
Outputs, Inputs and Productivity in the NHS Mary O’Mahony presentation to the 4th NIESR Public Service Performance Conference Friday 20th January 2006
Summary of Report funded by Department of Health ‘Developing new approaches to measuring NHS outputs and productivity’ Diane Dawson, Hugh Gravelle, Mary O’Mahony, Andrew Street, Martin Weale, Adriana Castelli, Rowena Jacobs, Paul Kind, Pete Loveridge, Stephen Martin, Philip Stevens, Lucy Stokes NIESR Discussion Paper No. 264 http://www.niesr.ac.uk/pubs/searchdetail.php?PublicationID=905 and CHE Research Paper No. 6 http://www.york.ac.uk/inst/che/pdf/rp6.pdf
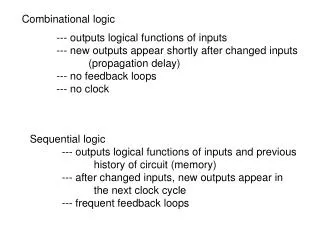
Main features of final report • A methodology for producing a comprehensive quality adjusted index of NHS output. • Methodologies for calculating quality adjusted NHS output indices with existing data. • Specimen indices for the small set of hospital based treatments where there are some data on health outcomes before and after treatment. • Suggestions on data required to improve future measurement of NHS output • A new index of labour input in the NHS. • Provisional estimates of Labour Productivity Growth and Total Factor Productivity Growth for the period 1998/99-2003/04.
NHS outputs in national accounts CWOI – Cost weighted output index x = activity, c = unit cost, j activities • Drawbacks • The NHS produces more than merely activities • Need to include “quality adjustment” • Using costs as weights • Assumes resources are optimally allocated across procedures
Quality Adjustment • We distinguish activities (operative procedures, diagnostic tests, outpatient visits, consultations…), outputs (courses of treatment for a patient which may require a bundle of activities), and outcomes (the characteristics of output which affect utility). • We define the quality of treatment as the level of the characteristics valued by patients and changes in quality as the rate of change of these characteristics. • No prices to reveal patients’ marginal valuations of NHS outputs • Estimate by considering the change in the basket of outcomes attributable to the NHS
Valued attributes of health care • Improvements in health status • Waiting times • Choice and certainty of date of treatment • Nursing care • Time & communication with staff • Food • Physical environment • Etc, etc …
Alternative indices Value weighted output index • Captures the various characteristics of health care produced by the NHS • Limited information currently prevents calculation for whole NHS • Report presents illustrative estimates for limited set of NHS activity Cost weighted output index with quality adjustments • Estimate quality adjusted CWOI for whole NHS as an interim way forward
Quality Adjusted Life Years - measures the change in the quality of life and the duration of the benefit h* with treatment, h0 without treatment Ideally we want to measure the area under the curve
Measuring health gain • In practice it will not be possible to measure this true treatment effect • few patients are left without treatment • Only observe difference between health state before treatment and after treatment and snapshot estimates at particular points in time. • Underestimates the benefit of NHS treatment, i.e. health with and without care • Currently, before and after treatment measures are only available for a small number of procedures • Report recommends gathering these data routinely • Report instead incorporates quality adjustments using changes in short term (30 day) mortality rates
Waiting Times • Waiting times (w) can be directly incorporated in CWOI if their impact is delaying health gain from treatment. • Changes in waits change the discounted sum of health effects of treatment: they are a “scaling factor”. • Effect cannot be disentangled from the length of time over which the health gain will be enjoyed – hence life expectancy assumptions are crucial • Report considers a number of alternative ways of representing waiting times: • preferred measure is one where interest is charged on the cost of waiting and the marginal disutility of waiting increases with the length of the wait • Alternative is to use value weights based on existing estimates derived from choice experiments or contingency valuations • Report illustrates this method for a few procedures
Other adjustments • Readmissions • MRSA • cost of readmissions and MRSA are a deadweight loss which reduces the value of treatment. • Patient satisfaction • calculate indicators from responses to surveys of patient experience • Illustrative calculations as required data not available – these adjustments do not yield significant changes in the Indices
Results from short-term quality adjustments Hospital NHS
Recommendations on measuring output • Routine collection of outcomes (before and after treatment) data • Collection of longer term survival data • Undertake studies to assess relative value of characteristics of NHS output Costly process but can go a long way by using sample surveys and concentrating on major conditions
Expenditure is by no means uniform across treatments Cumulative expenditure shares: 1074 activities – 25% of expenditures accounted for by 20 activities, 50% by 74, 90% by 430
Inputs and Productivity • Divide inputs into three types: • Labour • Intermediate - drugs, clinical supplies, energy etc. • Capital - Buildings, medical equipment, computers, transport equipment • Combine these three into an aggregate input index using the shares of inputs in total cost. • Derive productivity growth estimates as the growth in output minus the growth in aggregate input • Conceptually largest problem is with drugs • growing rapidly • should quality adjust so that innovations coming from the pharmaceutical sector are not attributed to the health sector
Average input shares 1998/99-2003/04 Labour is by far most important input in producing health services Much effort devoted to deriving better labour input measures that take account of the quality of labour (skills) Employed combination of NHS Census data for headcounts with Labour Force Survey data for hours and skill types
Ratio growth in quality adjusted labour to growth in numbers employed,Selected occupations,1995-03 and 2000-03 (>1 = upskilling)
TFP growth: Selected sectors, annual average 1995-2000 Total private economy, UK: With quality adjusted labour 0.35 With no quality adjustment on labour 0.56 Source: Bank of England – figures by sector do not include adjustment for labour quality
Reasons for negative TFP growth • Underestimate change in the quality of output • Adjustment lags following reform and increased expenditure • Diminishing returns • If increases in activities are more and more targeted at complex (and more costly) cases within health procedure groups
Conclusions • Reasonable quality adjusted output and productivity measures are feasible but require some commitment to obtaining the required data • Data will be useful in a number of contexts including cost-effectiveness analysis of particular treatments. • Proposed approaches are also useful in measuring output and productivity at sub-national levels, leading to improved monitoring of Trust performance