Download
1 / 17
190 likes | 364 Vues
Environmental Economics. Class 7. Incentive Based Regulation: Basic Concepts. Up to this point, the focus has been on resource allocation.

E N D
Environmental Economics Class 7
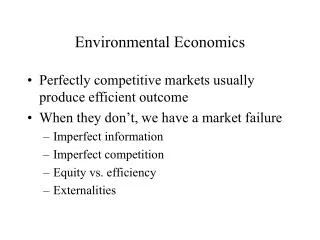
Incentive Based Regulation: Basic Concepts • Up to this point, the focushas been on resource allocation. • Since the use of resources creates waste, we addressthe questions of: 1) how much waste is appropriate and 2)what are the appropriate means for pollution reduction?
A Pollutant Taxonomy • The ability of the environment to absorb pollutants is called its absorptivecapacity. • Stock pollutants are pollutants for which the environment has little or noabsorptive capacity. Stock pollutants accumulate over time and includethings like nonbiodegradable bottles, heavy metals and chemicals such asPCBs. • Fund pollutants are pollutants for which the environment has someabsorptive capacity. If the emission rate does not exceed the absorptivecapacity, fund pollutants do not accumulate. These include organicpollutants and carbon dioxide.
Local pollutants cause damage near the source of emissions whileregional pollutants cause damage at greater distances. A pollutant couldfit both categories (e.g. sulfur and nitrogen oxides). This is the horizontaldimension of influence. • The vertical zone of influence refers to whether the pollution damages aremostly at ground level or if they accumulate in the upper atmosphere. • Surface pollutants (water pollution) cause damage near the earth’ssurface, while global pollutants (carbon dioxide and chlorofluorocarbons)cause damage in the upper atmosphere. Some air pollutants are bothsurface and global pollutants.
Efficient Allocation of Polutants • Fund pollutants can be examined using a static analysis because the level offuture damages is independent of current emissions. Time periods can thus beanalyzed separately. • Pollution control is most easily analyzed from the perspective of minimizingcost rather than maximizing the net benefits from pollution. • Two types of costs associated with pollution are: 1. Damage costs; and 2. Pollution control or avoidance costs.
Marginal damage costs generally increase with the amount of pollution. Withsmall amounts, the pollutant can be diluted in the environment. Largeramounts will tend to cause substantially more damage. This relationship canbe represented by an upward sloping function in a graph illustrating marginalcost as a function of pollution emitted. • Marginal control costs typically increase with the amount of pollution that iscontrolled or abated. Since the axis of this graph is pollution emitted, this willbe a downward sloping function. This is equivalent to an upward slopingfunction if the axis were to measure pollution controlled or if the graph is readfrom right to left.
The cost-minimizing solution is found by equating marginal damage costs tomarginal control costs (or at Q* in Figure 13.2). Points to the left of Q*(greater control) are inefficient because the marginal cost of control is greaterthan the marginal damage and reflects higher total costs. Likewise, points tothe right of Q* are also inefficient, but now because marginal damage costs arehigher than marginal control costs. There is too much pollution. • The optimal level of pollution would be zero only if the marginal damage costfunction is everywhere above the marginal control cost function. Anextremely toxic pollutant would cause this to be the case. [How do you draw this.] • Optimal levels of pollution will vary by location and by pollutant.
Market Allocation of Pollution • Damage costs are externalities. Damages are downwind or downstream ofthe sources (firms) that emit the pollutants. Thus, the uncontrolled marketwill produce too much. • Control costs are not externalities. • For stock pollutants, the market would commit too few resources topollution control and the burden on future generations would beinefficiently large. • Firms that attempt to control pollution unilaterally are placed at acompetitive disadvantage. • Therefore, the market fails to generate the efficient level of pollutioncontrol and penalizes firms that attempt to control pollution.
Efficiency is achieved when the marginal cost of control is equal to themarginal damage caused by the pollution for each emitter. • One policy option for achieving efficiency would be to impose a legal limit onthe amount of pollution allowed by each emitter. • Another approach would be to internalize the marginal damage caused byeach unit of emissions by means of a tax or charge per unit of emissions. Thecharge could be constant or it could rise with emissions. The efficient chargewould be equal to the marginal damage and marginal control cost at the pointwhere they are equal.
Knowing the level of pollution at which these two curves cross is difficult atbest. Control cost information is not always available to the pollution controlauthority and estimates of damage costs are very difficult. [Review nonmarketvaluation.] • In the absence of that knowledge, pollution control authorities could selectlegal levels of pollution based on some other criteria such as safety, humanhealth or ecological heath. Once this level is set, the most cost-effective policycould be chosen.
Cost Effective Policies • 1. Assume two emission sources are currently emitting a total of 30 unitsof emission. • 2. Assume the control authority decided a mandatory reduction of 15units is necessary. • 3. The question then becomes: how should the 15-unit reduction beallocated between the two sources in order to minimize cost?
Figure 13.3 illustrates the solution to the model. The graph is drawn such thatthe left-hand vertical axis measures the marginal control cost to emissionsource 1 and the right-hand vertical axis measures the marginal control cost toemission source 2. The horizontal axis is the constrained to equal 15 –measured from either direction. This ensures that any point will representsome combination allocated across the two sources that adds to 15. [This isequivalent to flipping over a graph measuring control costs for source two andusing the box as the constrain.]
The cost-effective allocation is found by equating the marginal control costsof the two sources. Since total cost is the area under the marginal control costcurve, total costs across the two firms is minimized by minimizing the twoareas and is found by equating the two marginal costs. Any other allocationwould result in higher total cost.
While simple in theory, the situation is more difficult for control authoritiesbecause control authorities do not often have access to good information aboutfirms’ costs. Plant managers have incentives to overstate costs. Other policyoptions or pollution control policies must be utilized.
Pollution control policies • 1. Emission Standards a. An emission standard is a legal limit on the amount of the pollutantan individual source is allowed to emit. b. This approach is referred to as command-and-control. c. The difficulty with this approach is determining how the standardshould be allocated across sources. The simplest means of allocation –allocating an equal share to each source – is rarely cost-effective. Inthe example given, it is not cost-effective.
2. Emissions charges • a. An emission charge is a per-unit of pollutant fee, collected by thegovernment. • b. Charges are economic incentives that reduce pollution because theycost the firm money. • c. A profit-maximizing firm will control (abate) pollution whenever thefee is greater than the marginal control cost. • d. Each firm will independently reduce emissions until its marginalcontrol cost equals the emission charge. This yields a cost-effectiveallocation (Figure 13.4). • e. A difficulty with this approach is determining how high the chargeshould be set in order to ensure that the resulting emission reduction isat the desired level. An iterative or trial-and-error approach can beused to determine the appropriate rate, but changing tax ratesfrequently is not usually politically feasible. • f. Another difficulty is that with a charge system, the total amount ofpollution cannot be controlled. If many new sources enter the market,they will still pay the fee, but total emissions will rise.
3. Transferable emissions permits • a. With a transferable emission permit system, all sources are requiredto have permits in order to emit. Each permit specifies how much thefirm is allowed to emit. The permits are freely transferable. • b. The control authority issues the exact number of permits necessary toachieve the standard. • c. Firms with high marginal costs of control will have incentives to buypermits from firms with low marginal control costs. Firms with lowmarginal control costs will have incentives to see if the permit price isabove their marginal control cost. The equilibrium permit price will bethe price at which the marginal control costs are equal for both (oracross all) firms. • d. The incentives embedded in this system ensure lowest costs and thecontrol authority does not need information on control costs.