Download

1 / 26
260 likes | 531 Vues
TC Winds Conference Call. Wednesday, August 8, 2012 11 :00 AM. Agenda. Holland et al. (2010) model NDFD Verification Focuses next month Input from collaborators. Example: Irene (2011) 2100 UTC 25 August. TCM Data: Max winds: 100 KT

E N D
TC Winds Conference Call Wednesday, August 8, 2012 11:00 AM
Agenda • Holland et al. (2010) model • NDFD Verification • Focuses next month • Input from collaborators
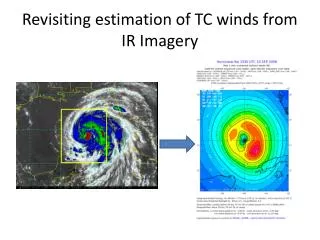
Example: Irene (2011)2100 UTC 25 August • TCM Data: Max winds: 100 KT 64 KT: 70NE 60SE 25SW 50NW.50 KT: 110NE 100SE 50SW 75NW.34 KT: 250NE 200SE 125SW 160NW.
Appears Holland et al. (2010) winds are stronger than modified Rankine vortex interpolation Prior Radial Plot: Distorted!
Example Plot: Irene (2011)2100 UTC 25 August • TCM Data: Max winds: 100 KT 64 KT: 70NE 60SE 25SW 50NW.50 KT: 110NE 100SE 50SW 75NW.34 KT: 250NE 200SE 125SW 160NW. Holland et al. wind speeds lower everywhere in the quadrant (Quadrant 1 Cross Section)
Holland et al. 2010 • Working with Anantha to convert data into cylindrical (R, θ) coordinates to remove distortion based on distance from storm center • In meantime, plots of wind speed vs. distance from storm center will be generated for all four quadrants
Holland et al. 2010: Proposed Verification • Compare to H*Wind analyses for recent TCs affecting the region (various strengths, sizes) • “[The Holland et al. model] has considerably less sensitivity to data errors compared to the original.” • Conduct sensitivity analysis to various wind radii
NHC Guidance • Chris Landsea at NHC conducted a survey of hurricane specialists on estimates of analysis uncertainty for best track parameters of US landfall events • Tropical Storms • 34 kt: 24.1 n mi • 50 kt: 16.6 n mi • 64 kt: N/A • Cat 1-2 Hurricanes • 34 kt: 23.8 n mi • 50 kt: 19.3 n mi • 64 kt: 12.9 n mi • Major Hurricanes • 34 kt: 24.5 n mi • 50 kt: 19.1 n mi • 64 kt: 13.4 n mi
Holland et al. 2010: Proposed Verification • In addition to comparison to H*Wind surface analyses, a sensitivity analysis will be conducted to these maximum wind radii • Results will be highlighted on blog, presented formally at next conference call
NDFD Verification • Absolute bias at the individual times: The NDFD forecasted wind speed for the analysis time, minus the H*Wind surface wind speed (knots). Positive values indicate over prediction of wind speeds, and negative values indicate under prediction of wind speeds. • Bias analysis at individual times, normalized by H*Wind wind speed at that grid point: The same as the previous plots, only divided by the H*Wind analyzed wind speed at each grid point. The values represent bias percent over analyzed wind speed at that time/location. Positive percentages indicate over prediction of wind speeds, and negative percentages indicate under prediction of wind speeds. • Average bias, normalized by the average H*Wind analyzed wind speed at that grid point: The average difference between the NDFD forecasted wind speeds and the H*Wind surface analysis wind speed, normalized by the average H*Wind analyzed wind speed at that grid point. The values represent average bias percent over analyzed average wind speed at that location. Positive percentages indicate over prediction of wind speeds, and negative percentages indicate under prediction of wind speeds.
NDFD Verification • Maximum forecast bias at any given analysis time: The maximum difference at each grid point between the NDFD forecasted wind speed at a given time and the H*Wind surface analysis wind speed at that time. The values represent the maximum forecast error at any given location over all analysis times. Postive values indicate over prediction of wind speeds, and negative values indicate under prediction of wind speeds. • Maximum forecast bias: Calculated as the difference between maximum NDFD forecast wind speed and maximum H*Wind analysis wind speed grids • ASOS Point maximum forecast bias: Calculated as the difference between maximum NDFD forecast wind speed and maximum H*Wind analysis wind speed grids. The closest grid point to ASOS stations within the study domain are used for the analysis. Various forecast cycles prior to the H*Wind analyzed times are present (latest, 24, and 48 hour forecasts). • URL: http://www4.ncsu.edu/~bptyner/
Focuses Next Few Weeks • Presentation at Graduate Student Symposium next week • Holland et al. (2010) • Sensitivity to various maximum wind radii • Comparison to H*Wind analyses • Finalize NDFD report for paper • Add point forecast information • Add CRONOS station observations to analysis • Need input from collaborators! • Share on blog • Gust factor write up for paper • Include work from NCSU undergraduate students posted pon blog
Open Discussion • Questions/Comments • Discussion points: • No collaborator input yet! How do we get this going? Sample form to be sent out? • Next Conference Call: Wednesday, September 12th at 11:00 am
Developing a Wind Gust Factor Database from 10 Tropical Cyclones for use in GFE Tool Development
We examined the sustained winds, wind gusts, peak winds, and gust factors for ten tropical cyclones that impacted the Carolinas and Virginia. Hourly observations of winds and wind gusts from approximately 30 regular ASOS or AWOS METAR locations impacted by the various storms were collected. The locations varied for each storm and were selected to capture the variations in the wind field. Observations from routine hourly METARs were used. For the ten tropical cyclones examined, the hourly wind gust factor for each METAR location was computed as the ratio of the wind gust to the sustained wind speed. A total of 14,938 gust factors were computed for all of the storms.
Winds and wind gusts from hourly observations were examined for ten tropical cyclones that impacted the Carolinas and Virginia. From this data, for each storm, the Gust Factor was compared with the wind speed for each hour resulting in 14,938 gust factors.
Winds and wind gusts from hourly observations were examined for ten tropical cyclones that impacted the Carolinas and Virginia. From this data, for each storm, the Gust Factor was compared with the wind speed for each hour resulting in 14,938 gust factors.
For each storm a regression equation was developed. One equation was then produced for all of the storms (shown in black below)
The unified equation: y = -0.173ln(x) + 1.9506 Or: Wind Gust Factor = -0.173*ln(Wind) + 1.9506 Was coded into smart tools called: “TCWindGust” “WindGustFactor_from_Regression” The “TCWindGust” tool provides the user with an option to use the regression equation, the mean value, or other exposure driven values.
The Wind grid is shown below. The TCWindGust tool uses the Wind grid to “sketch” out a WindGust grid.
The WindGust grid is shown below. The TCWindGust tool uses the Wind grid to “sketch” out a WindGust grid.
The Wind grid is shown below. The WindGustFactor_from_Regression tool uses the Wind speed and provides a first guess WindGustFactor grid.
The WindGustFactor grid is shown below. The first guess WindGustFactor values were produced via a regression equation that uses the Wind speed. Forecasters can modify and edit as these values for factors such as static stability, surface roughness, distance from the storm, etc .
The WindGust grid is shown below. The WindGust grids below were produced via the WindGust_from_WindGustFactor tool.
Both smart tools are being tested and need some additional minor coding work. • “TCWindGust” • “WindGustFactor_from_Regression” • A couple of questions remain for the “TCWindGust” tool: • How to handle winds less than 10 MPH? • Suggest assigning a GF of 1.55 to winds < 10MPH • 2) How to handle higher end winds >70 MPH beyond as GF asymptotes out toward 1.0. A GF of 1.2 is reached at 76.6 MPH while a GF of 1.15 is reached at 102.3 MPH • Can assign a GF of 1.2 > 72 MPH or 1.15 > 102 MPH • 3) Need to add quantitative data for over water environments. • AKQ has a dataset or we can build upon prior research which suggest over water GF ranges from 1.1 to 1.2
CSTAR TC Wind Research to Operations (R2O) Activities • 1) Training and Conceptual Models • Recognition of the problem - done • Training slides including 1) challenges 2) best practices 3) take away message - done • TCMwind Tool reference improvements (planned) • New comprehensive training reference (planned) • 2) Quality Assurance Tools • MaxWind grid - done • MaxWindGust grid - done • 3) Preliminary and Simplified GFE Tools • TCWindGust tool - testing • Climatological edit areas based on Maria work? • 4) Larger and Significant GFE Tools and Changes • WindReductionFactor grid and tools - done • WindGustFactor grid and tools - done • Next Generation TCWindTool with improved Rankine Vortex (in progress)