Analysis of BMI Trends in Young Cohorts Using Twin Study Data
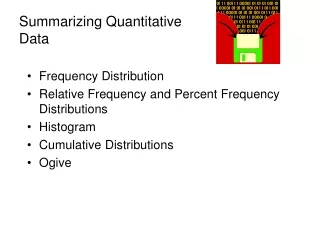
This study utilizes data from the NH&MRC Twin Register collected in 1981, focusing on young adults aged 18-30. The dataset includes BMI measurements based on weight and height for 534 monozygotic (MZ) and 328 dizygotic (DZ) twins. We employ Maximum Likelihood (ML) estimation to assess variance in BMI and compare means and variances between MZ and DZ twins using saturated models. The analysis aims to evaluate genetic and environmental influences on BMI, revealing insights into familial resemblance in body weight characteristics.

Analysis of BMI Trends in Young Cohorts Using Twin Study Data
E N D
Presentation Transcript
Summarizing Data HGEN619 class 2006
Practical Example • Dataset: NH&MRC Twin Register • 1981 questionnaire • BMI: weight/ height squared • Young cohort: 18-30 years • N MZFY: 534, DZFY: 328
Raw Dataset ozbmi.rec 115 21 1 2 58 57 1.7000 1.7000 20.0692 19.7232 20.9943 20.8726 121 24 1 2 54 53 1.6299 1.6299 20.3244 19.9481 21.0828 20.9519 158 21 1 2 55 50 1.6499 1.6799 20.2020 17.7154 21.0405 20.1210 172 21 1 2 66 76 1.5698 1.6499 26.7759 27.9155 23.0125 23.3043 182 19 1 2 50 48 1.6099 1.6299 19.2894 18.0662 20.7169 20.2583 199 26 1 2 60 60 1.5999 1.5698 23.4375 24.3418 22.0804 22.3454 221 23 1 2 65 65 1.7500 1.7698 21.2245 20.7476 21.3861 21.2270 239 29 1 2 40 39 1.5598 1.5298 16.4366 16.6603 19.5966 19.6912 246 24 1 2 60 57 1.7598 1.7698 19.3698 18.1940 20.7460 20.3076 251 28 1 2 76 64 1.7000 1.7300 26.2976 21.3839 22.8863 21.4385 262 29 1 2 48 51 1.5198 1.5698 20.7756 20.6905 21.2365 21.2077 284 19 1 2 70 67 1.6799 1.6799 24.8016 23.7387 22.4764 22.1697 524 20 1 2 53 50 1.6199 1.6299 20.1951 18.8189 21.0381 20.5440 535 22 1 2 57 55 1.5798 1.5999 22.8329 21.4844 21.8974 21.4713 582 26 1 2 62 61 1.6799 1.6399 21.9671 22.6800 21.6268 21.8504 587 28 1 2 60 58 1.6299 1.6399 22.5827 21.5645 21.8203 21.4974 588 19 1 2 55 55 1.5698 1.5698 22.3133 22.3133 21.7363 21.7363 621 21 1 2 46 49 1.5698 1.5498 18.6620 20.3954 20.4854 21.1072 630 27 1 1 54 55 1.7698 . 17.2364 . 19.9292 . 631 28 1 2 58 60 1.6899 1.6899 20.3074 21.0077 21.0769 21.3142
Dat File: ozbmi.dat • #include ozbmi.dat • Data NInput=12 • Rectangular File=ozbmi.rec • Labels fam age zyg part wt1 wt2 ht1 ht2 htwt1 htwt2 bmi1 bmi2
Estimating Variance by ML • MxGui Interface • Datamap • Draw • Run • Path Inspector • Manager • Mx Script Language
#NGroups 2 #define nvar2 2 Title 1: MZ data #include ozbmi.dat Select if zyg =1 Select bmi1 bmi2 ; Begin Matrices; M Full 1 nvar2 Free X Symm nvar2 nvar2 Free End Matrices; Start 20 M 1 1 - M 1 nvar2 Start 1 X 1 1 X 2 2 Means M; Covariance X; Option RSiduals End Title 2: DZ data #include ozbmi.dat Select if zyg =3 Select bmi1 bmi2 ; Begin Matrices; M Full 1 nvar2 Free X Symm nvar2 nvar2 Free End Matrices; Start 20 M 1 1 - M 1 nvar2 Start 1 X 1 1 X 2 2 Means M; Covariance X; Option RSiduals End ! Estimate means and variances - Saturated model! OZ BMI data - young females
Saturated Model MZ & DZ MZ twins DZ twins 10 parameters
Equality of means, variances MZ twins DZ twins 4 parameters
Tests • Saturated model • Equality of means • Is m1 = m2 ? • Is m1MZ = m1DZ = m2MZ = m2DZ ? • Equality of variances • Is v1 = v2 ? • Is v1MZ = v1DZ = v2MZ = v2DZ ?
Main Script Last Group .... Option Multiple Issat End Save ozbmisat.mxs ! equate means and variances Equate M 1 1 1 M 1 1 2 M 2 1 1 M 2 1 2 Equate X 1 1 1 X 1 2 2 X 2 1 1 X 2 2 2 End Equality Tests
Specific Equality Tests • Get ozbmisat.mxs • ! equate means within zygosity groups • Equate M 1 1 1 M 1 1 2 • Equate M 2 1 1 M 2 1 2 • End • ! equate means across zygosity groups • Equate M 1 1 1 M 1 1 2 M 2 1 1 M 2 1 2 • End • ! equate variances within zygosity groups • Equate X 1 1 1 X 1 2 2 • Equate X 2 1 1 X 2 2 2 • End • ! equate variances across zygosity groups • Equate X 1 1 1 X 1 2 2 X 2 1 1 X 2 2 2 • End
Tests • ACE model • Is a significant ? -> CE model • Is c significant ? -> AE model • Is there significant family resemblance ? -> E model • ADE model
#NGroups 4 #define nvar 1 #define nvar2 2 Title 1: Model Parameters Calculation Begin Matrices; X Lower nvar nvar Free ! a Y Lower nvar nvar ! c Z Lower nvar nvar Free ! e W Lower nvar nvar Free ! d H Full 1 1 ! 0.5 Q Full 1 1 ! 0.25 End Matrices; Matrix H .5 Matrix Q .25 Label Row X add_gen Label Row Y com_env Label Row Z spec_env Label Row W dom_gen Begin Algebra; A= X*X'; ! a^2 C= Y*Y'; ! c^2 E= Z*Z'; ! e^2 D= W*W'; ! d^2 End Algebra; End ! Estimate variance components - ACED model! OZ BMI data - younger females
Title 2: MZ data #include ozbmi.dat Select if zyg =1 Select bmi1 bmi2 ; Begin Matrices = Group 1; M Full 1 nvar2 Free End Matrices; Means M; Covariance A+C+E+D | A+C+D _ A+C+D | A+C+E+D; Option RSiduals; End Title 3: DZ data #include ozbmi.dat Select if zyg =3 Select bmi1 bmi2 ; Begin Matrices = Group 1; M Full 1 nvar2 Free End Matrices; Means M; Covariance A+C+E+D | H@A+C+Q@D _ H@A+C+Q@D | A+C+E+D; Option RSiduals End ! Estimate variance components - ACED model! OZ BMI data - younger females II
! Estimate variance components - ACED model! OZ BMI data - younger females III • Title 4: Standardization • Calculation • Begin Matrices = Group 1; • End Matrices; • Start .6 all • Start 20 M 2 1 1 - M 2 1 nvar2 • Start 20 M 3 1 1 - M 3 1 nvar2 • Begin Algebra; • V=A+C+E+D; ! total variance • P=A|C|E|D; ! concatenate parameter estimates • S=P@V~; ! standardized parameter estimates • End Algebra; • !ADE model • Interval S 1 1 - S 1 4 • Option NDecimals=4 • Option Sat=4055.935,1767 • End