Database Searches
110 likes | 232 Vues
This document explores peptide mass fingerprinting techniques in proteomics, highlighting the processing of mass spectra to identify proteins. It covers essential steps including baseline correction, noise reduction, and peak deisotoping, leading to the generation of a peak list for theoretical protein digests. The use of algorithms for database searching, such as MASCOT, is also discussed. A focus on practical applications, including data extraction to Excel for further analysis, aids in the identification of peptides that comprise a significant portion of proteins, ensuring confident results despite partial coverage.

Database Searches
E N D
Presentation Transcript
Peptide mass fingerprinting 1554.25 2055.39 1942.44 1755.67 987.55 855.34 677.68 Spectrum processing digest MS Peak list Protein (gel band or spot) Mass spectrum peptides Search Protein X theoretical digest Protein Y theoretical digest Protein Z theoretical digest Report HIT SCORE Protein X 1000 Protein Y 50 Protein Z 5
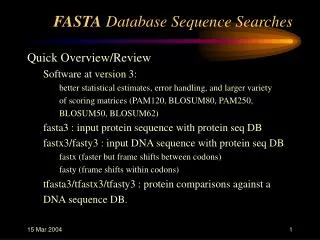
Data processing …before searching • Baseline correct • Noise reduction • Peak deisotope for monoisotopic peaks …what is a monoisotopic peak • Copy to Excel and sort for peak intensity • Search with the top 75 peak ions (peptides)
Generate mass list of all peptides • Computer program used to convert graph data (from mass spectrum) to table data (list of peptide masses)
Simple Mass Spectrum Intensity 681.7 200 400 600 800 1000 1200 1400 1600 Mass (Da)
Database search using computer algorithm PLEASEMAKEMANYKRISPYKREMETREATSTHEYAREGREAT e.g. MASCOT Sequence matches List of masses
Mass list of all peptides in the mass spectrum copied into here www.matrixscience.com
Coverage = 26% We found peptides that make up only ¼ of the entire protein – but this is enough for a confident identification!