Download
1 / 36
360 likes | 383 Vues
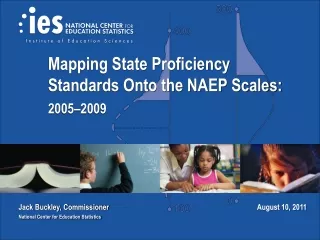
Mapping State Proficiency Standards Onto the NAEP Scales: 2005–2009. Jack Buckley, Commissioner National Center for Education Statistics. August 10, 2011. The Challenge: Comparing State Standards. Each state designs its own tests and sets its own standards

E N D
Mapping State Proficiency Standards Onto the NAEP Scales: 2005–2009 Jack Buckley, Commissioner National Center for Education Statistics August 10, 2011
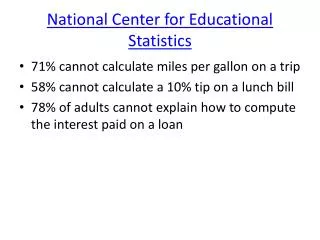
The Challenge: Comparing State Standards • Each state designs its own tests and sets its own standards • States report percent proficient to the U.S. Department of Education • Policymakers compare state performance standards—but without a common yardstick 2
Percent Proficient Reading Grade 8, 2009
Understanding the Displays NAEP equivalent score as calculated by mapping method ± 2 standard errors State has relative error > .5
State Proficiency Standards Reading Grade 4, 2009 64 pts ▲Inferences based on estimates with relative error greater than .5 may require additional evidence. NOTE: In Nebraska, each district develops local assessments to report on standards. Therefore, the state was not included in the analyses. SOURCE: U.S. Department of Education, Institute of Education Sciences, National Center for Education Statistics, National Assessment of Educational Progress (NAEP), 2009 Reading Assessments. U.S. Department of Education, Office of Planning, Evaluation and Policy Development, EDFacts SY 2008–09, Washington, DC, 2010. The National Longitudinal School-Level State Assessment Score Database (NLSLSASD) 2010.
State Proficiency Standards Reading Grade 4, 2009
State Proficiency Standards Reading Grade 8, 2009 66 pts ▲Inferences based on estimates with relative error greater than .5 may require additional evidence. NOTE: In Nebraska, each district develops local assessments to report on standards. Therefore, the state was not included in the analyses. SOURCE: U.S. Department of Education, Institute of Education Sciences, National Center for Education Statistics, National Assessment of Educational Progress (NAEP), 2009 Reading Assessments. U.S. Department of Education, Office of Planning, Evaluation and Policy Development, EDFacts SY 2008–09, Washington, DC, 2010. The National Longitudinal School-Level State Assessment Score Database (NLSLSASD) 2010.
State Proficiency Standards Reading Grade 8, 2009
State Proficiency Standards Mathematics Grade 4, 2009 ▲Inferences based on estimates with relative error greater than .5 may require additional evidence. NOTE: In Nebraska, each district develops local assessments to report on standards. Therefore, the state was not included in the analyses. SOURCE: U.S. Department of Education, Institute of Education Sciences, National Center for Education Statistics, National Assessment of Educational Progress (NAEP), 2009 Mathematics Assessments. U.S. Department of Education, Office of Planning, Evaluation and Policy Development, EDFacts SY 2008–09, Washington, DC, 2010. The National Longitudinal School-Level State Assessment Score Database (NLSLSASD) 2010.
State Proficiency Standards Mathematics Grade 4, 2009
State Proficiency Standards Mathematics Grade 8, 2009 ▲Inferences based on estimates with relative error greater than .5 may require additional evidence. NOTE: In Nebraska, each district develops local assessments to report on standards. Therefore, the state was not included in the analyses. California was not included because the state does not test general mathematics. SOURCE: U.S. Department of Education, Institute of Education Sciences, National Center for Education Statistics, National Assessment of Educational Progress (NAEP), 2009 Mathematics Assessments. U.S. Department of Education, Office of Planning, Evaluation and Policy Development, EDFacts SY 2008–09, Washington, DC, 2010. The National Longitudinal School-Level State Assessment Score Database (NLSLSASD) 2010.
State Proficiency Standards Mathematics Grade 8, 2009
State Standards vs. NAEP Achievement Mathematics Grade 8, 2009
Changes in State Assessments • Some states reported that key aspects of their assessment changed
State Proficiency Standards 2009 vs. 2007 Reading Grade 4
State Proficiency Standards 2009 vs. 2005 Reading Grade 4
State Proficiency Standards 2009 vs. 2007 Reading Grade 8
State Proficiency Standards 2009 vs. 2005 Reading Grade 8
State Proficiency Standards 2009 vs. 2007 Mathematics Grade 4
State Proficiency Standards 2009 vs. 2005 Mathematics Grade 4
State Proficiency Standards 2009 vs. 2007 Mathematics Grade 8
State Proficiency Standards 2009 vs. 2005 Mathematics Grade 8
Changes in Standards from 2007 to 2009 Among states that changed key aspects of their assessment system from 2007 to 2009, more increased the rigor of their proficiency standards 25
Changes in Standards from 2005 to 2009 Among states that changed key aspects of their assessment system from 2005 to 2009, more decreased the rigor of their proficiency standards 26
Example of NAEP Not Corroborating State Change Reading Grade 8 91.6 –7.1* 5.5 –1.6 84.4 86.1 86.1
Example of NAEP Corroborating State Change Reading Grade 8 88.1 0.0 1.1 87.0 87.0 87.0 1.1
Comparing Measures of Change in Reading Achievement From 2007 to 2009 30
Comparing Measures of Change in Mathematics Achievement From 2007 to 2009 31
Summary: 2009 State Standards • There is wide variation among state proficiency standards: 60 to 71 points, depending on subject and grade. • Most states’ proficiency standards are at or below NAEP’s definition of Basic performance. 33
Summary: Change in State Standards • Most states among those that made substantive changes in their assessment between 2007 and 2009 moved toward more rigorous standards. • For those states that made substantive changes in their assessment between 2005 and 2009 there were more decreases than increases in the rigor of their standards. 34
For More Information http://nces.ed.gov/nationsreportcard/studies/statemapping/