Functions and Models: Transformations Guide
Learn how to obtain new functions from old functions by shifting, stretching, and reflecting their graphs. Combine pairs of functions using standard arithmetic operations and composition. Explore translations, shifting, stretching, and reflecting transformations. Practice with examples.

Functions and Models: Transformations Guide
E N D
Presentation Transcript
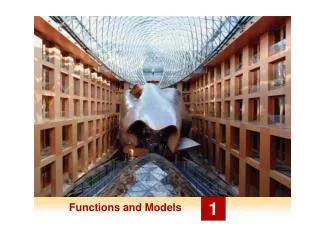
1 FUNCTIONS AND MODELS
FUNCTIONS AND MODELS 1.3 New Functions from Old Functions • In this section, we will learn: • How to obtain new functions from old functions • and how to combine pairs of functions.
NEW FUNCTIONS FROM OLD FUNCTIONS • In this section, we: • Start with the basic functions we discussed in Section 1.2 and obtain new functions by shifting, stretching, and reflecting their graphs. • We also show how to combine pairs of functions by the standard arithmetic operations and by composition.
TRANSFORMATIONS OF FUNCTIONS • By applying certain transformations • to the graph of a given function, • we can obtain the graphs of certain • related functions. • This will give us the ability to sketch the graphs of many functions quickly by hand. • It will also enable us to write equations for given graphs.
TRANSLATIONS • Let’s first consider translations. • If c is a positive number, then the graph of y = f(x) + c is just the graph of y = f(x) shifted upward a distance of c units. • This is because each y-coordinate is increased by the same number c. • Similarly, if g(x) = f(x - c) ,where c > 0, then the value of g at x is the same as the value of f at x - c (c units to the left of x).
TRANSLATIONS • Therefore, the graph of y = f(x - c) is just the graph of y = f(x) shifted c units to the right.
SHIFTING • Suppose c > 0. • To obtain the graph of y = f(x) +c, shift the graph of y =f(x) a distance c units upward. • To obtain the graph of y =f(x) -c, shift the graph of y =f(x) a distance c units downward.
SHIFTING • To obtain the graph of y =f(x - c), shift the graph of y =f(x) a distance c units to the right. • To obtain the graph of y =f(x + c), shift the graph of y =f(x) a distance c units to the left.
STRETCHING AND REFLECTING • Now, let’s consider the stretching and • reflecting transformations. • If c > 1, then the graph of y = cf(x) is the graphof y = f(x) stretched by a factor of c in the vertical direction. • This is because each y-coordinate is multiplied by the same number c.
STRETCHING AND REFLECTING • The graph of y = -f(x) is the graph of y = f(x) reflected about the x-axis because the point (x, y) is replaced by the point (x, -y).
TRANSFORMATIONS • The results of other stretching, • compressing, and reflecting • transformations are given on the next • few slides.
TRANSFORMATIONS • Suppose c > 1. • To obtain the graph of y = cf(x), stretch the graph of y = f(x) vertically by a factor of c. • To obtain the graph of y = (1/c)f(x), compress the graph of y = f(x) vertically by a factor of c.
TRANSFORMATIONS • In order to obtain the graph of y = f(cx), compress the graph of y = f(x) horizontally by a factor of c. • To obtain the graph of y = f(x/c), stretch the graph of y = f(x) horizontally by a factor of c.
TRANSFORMATIONS • In order to obtain the graph of y = -f(x), reflect the graph of y = f(x) about the x-axis. • To obtain the graph of y = f(-x), reflect the graph of y = f(x) about the y-axis.
TRANSFORMATIONS • The figure illustrates these stretching • transformations when applied to the cosine • function with c = 2.
TRANSFORMATIONS • For instance, in order to get the graph of • y = 2 cos x, we multiply the y-coordinate of • each point on the graph of y = cos x by 2.
TRANSFORMATIONS • This means that the graph of y = cos x • gets stretched vertically by a factor of 2.
TRANSFORMATIONS Example 1 • Given the graph of , use • transformations to graph: • a. • b. • c. • d. • e.
TRANSFORMATIONS Example 1 • The graph of the square root • function is shown in part (a).
TRANSFORMATIONS Example 1 • In the other parts of the figure, • we sketch: • by shifting 2 units downward. • by shifting 2 units to the right. • by reflecting about the x-axis. • by stretching vertically by a factor of 2. • by reflecting about the y-axis.
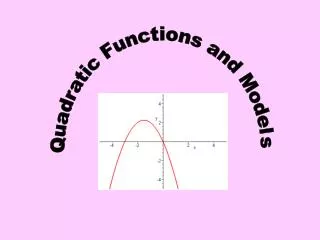
TRANSFORMATIONS Example 2 • Sketch the graph of the function • f(x) = x2 + 6x + 10. • Completing the square, we write the equation of the graph as: y = x2 + 6x + 10 = (x + 3)2 + 1.
TRANSFORMATIONS Example 2 • This means we obtain the desired graph by starting with the parabola y = x2 and shifting 3 units to the left and then 1 unit upward.
TRANSFORMATIONS Example 3 • Sketch the graphs of the following • functions. • a. • b.
TRANSFORMATIONS Example 3 a • We obtain the graph of y = sin 2x from that • of y = sin x by compressing horizontally by • a factor of 2. • Thus, whereas the period of y = sin x is 2 , the period of y = sin 2x is 2 /2 = .
TRANSFORMATIONS Example 3 b • To obtain the graph of y = 1 – sin x , • we again start with y = sin x. • We reflect about the x-axis to get the graph ofy = -sin x. • Then, we shift 1 unit upward to get y = 1 – sin x.
TRANSFORMATIONS Example 4 • The figure shows graphs of the number • of hours of daylight as functions of • the time of the year at several latitudes.
TRANSFORMATIONS Example 4 • Given that Philadelphia is located at • approximately 40°N latitude, find a function • that models the length of daylight at • Philadelphia.
TRANSFORMATIONS Example 4 • Notice that each curve • resembles a shifted and stretched • sine function.
TRANSFORMATIONS Example 4 • By looking at the blue curve, we see that, • at the latitude of Philadelphia, daylight lasts • about 14.8 hours on June 21 and 9.2 hours • on December 21. • So, the amplitude ofthe curve—the factor by which we have to stretch the sine curvevertically—is: ½(14.8 – 9.2) = 2.8
TRANSFORMATIONS Example 4 • By what factor do we need to stretch • the sine curve horizontally if we measure • the time t in days? • As there are about 365 days in a year, the period of our model should be 365. • However, the period of y = sin t is . • So, the horizontalstretching factor is .
TRANSFORMATIONS Example 4 • We also notice that the curve begins • its cycle on March 21, the 80th day • of the year. • So, we have to shift the curve 80 units to the right. • In addition, we shift it 12 units upward.
TRANSFORMATIONS Example 4 • Therefore, we model the length of daylight • in Philadelphia on the t th day of the year • by the function:
TRANSFORMATIONS • Another transformation of some interest • is taking the absolute valueof a function. • If y = |f(x)|, then, according to the definition of absolute value, y = f(x) when f(x) ≥ 0 and y = -f(x) when f(x) < 0.
TRANSFORMATIONS • This tells us how to get the graph • of y = |f(x)| from the graph of y = f(x). • The part of the graph that lies above the x-axis remains the same. • The part that lies below the x-axis is reflected about the x-axis.
TRANSFORMATIONS Example 5 • Sketch the graph of the function • First, we graph the parabola y = x2 - 1 by shifting the parabola y = x2 downward 1 unit. • We see the graph lies below the x-axis when -1 < x < 1.
TRANSFORMATIONS Example 5 • So, we reflect that part of the graph about the x-axis to obtain the graph of y = |x2 - 1|.
COMBINATIONS OF FUNCTIONS • Two functions f and g can be combined • to form new functions f + g, f - g, fg, and • in a manner similar to the way we add, • subtract, multiply, and divide real numbers.
SUM AND DIFFERENCE • The sum and difference functions are defined by: • (f + g)x = f(x) + g(x) (f – g)x = f(x) – g(x) • If the domain of f is A and the domain of g is B, then the domain of f + g is the intersection . • This is because both f(x) and g(x) have to be defined.
SUM AND DIFFERENCE • For example, the domain of • is and the domain of • is . • So, the domain of • is .
PRODUCT AND QUOTIENT • Similarly, the product and quotient • functions are defined by: • The domain of fg is . • However, we can’t divide by 0. • So, the domain of f/g is
PRODUCT AND QUOTIENT • For instance, if f(x) = x2 and g(x) = x - 1, • then the domain of the rational function • is , • or
COMBINATIONS • There is another way of combining two • functions to obtain a new function. • For example, suppose that and • Since y is a function of u and u is, in turn, a function of x, it follows that y is ultimately a function of x. • We compute this by substitution:
COMBINATIONS • This procedure is called composition— • because the new function is composed • of the two given functions f and g.
COMPOSITION • In general, given any two functions f and g, • we start with a number x in the domain of g • and find its image g(x). • If this number g(x) is in the domain of f, then we can calculate the value of f(g(x)). • The result is a new function h(x) = f(g(x)) obtained by substituting g into f. • It is called the composition (or composite) of f and g. • It is denoted by (“f circle g”).
COMPOSITION Definition • Given two functions f and g, • the composite function • (also called the composition of f and g) • is defined by:
COMPOSITION • The domain of is the set of all x • in the domain of g such that g(x) is in • the domain of f. • In other words, is defined whenever both g(x) and f(g(x)) are defined.
COMPOSITION • The figure shows • how to picture • in terms of machines.
COMPOSITION Example 6 • If f(x) = x2 and g(x) = x - 3, find • the composite functions and . • We have:
COMPOSITION Note • You can see from Example 6 that, • in general, . • Remember, the notation means that, first,the function g is applied and, then, f is applied. • In Example 6, is the function that firstsubtracts 3 and thensquares; is the function that firstsquares and thensubtracts 3.
COMPOSITION Example 7 • If and , • find each function and its domain. • a. • b. • c. • d.