Priority
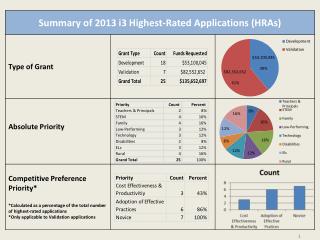
Priority. Count. Percent. Teachers & Principals. 2. 8%. STEM. 4. 16%. Family. 4. 16%. Low-Performing. 3. 12%. Technology. 3. 12%. Disabilities. 2. 8%. ELs. 3. 12%. Rural. 4. 16%. Grand Total. 25. 100%. Priority. Priority. Development. Development. Validation.

Priority
E N D
Presentation Transcript
Priority Count Percent Teachers & Principals 2 8% STEM 4 16% Family 4 16% Low-Performing 3 12% Technology 3 12% Disabilities 2 8% ELs 3 12% Rural 4 16% Grand Total 25 100%
Priority Priority Development Development Validation Validation Grand Total Grand Total Teachers & Principals Teachers & Principals $3,000,000.00 9,700 $12,000,000.00 48,000 $15,000,000 57,700 STEM STEM $8,999,712.00 5,495 $11,998,919.00 22,000 $20,998,631 27,495 Family Family $11,749,205.00 21,600 NA NA $11,749,205 21,600 Low-Performing Low-Performing $8,998,964.00 45,400 NA NA $8,998,964 45,400 Technology Technology $5,991,838.00 3,500 $12,000,000.00 100,000 $17,991,838 103,500 Disabilities Disabilities $5,399,989.00 3,620 NA NA $5,399,989 3,620 Els Els $6,000,000.00 17.153 $11,199,578.22 105,000 $17,199,578 122,153 Rural Rural $2,960,337.00 485 $35,354,155.00 77,683 $38,314,492 78,168 Grand Total Grand Total $53,100,045 106,953 $82,552,652 352,683 $135,652,697 459,636
Highest-Rated Application Data 25 HRA’s across 13 states and DC Note: Site level data is not reflected. States represent applicant’s location.