Evaluating Measures
Measurement Reliability and Validity. Evaluating Measures. Sources of measurement variation. There are three things that contribute to a respondent/individual’s score on a measure Three ‘components’ A true score component This is the good stuff Non-systematic (‘random’) error (‘noise’)

Evaluating Measures
E N D
Presentation Transcript
Measurement Reliability and Validity Evaluating Measures
Sources of measurement variation • There are three things that contribute to a respondent/individual’s score on a measure • Three ‘components’ • Atrue score component • This is the good stuff • Non-systematic (‘random’) error (‘noise’) • Systematic error (‘bias’)
Variance goods and bads • (Good) The ‘true score’ variance reflects the ‘correct’ placement of the individual on the measure. It correctly reflects the individual’s level on the concept being measured. • (Kind of bad) The nonsystematic error variance increases the distribution of scores around the true score, but does not change the estimates of population mean, percentages, etc.
Variance goods and bads • (Very bad) Systematic error (bias) misleads the researcher to believe that the population mean, percentages, etc. are different from the true value, that relationships exist that really don’t (and vice versa).
An example: • Let’s say you give someone a ruler and want them to measure the height of preschoolers • Because the measurer cannot simply line up the kids against the ruler and read off the score (she must find where one foot ends, hold that spot and move the ruler, etc.) error is introduced into the scores (height measurements) • Nonsystematic error is introduced if the measurer slips high sometimes and low other times when moving the ruler • Systematic error is introduced if she has a consistent tendency to start the second foot at a point which is actually between 11 and 12 inches
Another example: • When we want to measure some psychological trait of people we have no obvious way of doing it. We may come up with a list of questions meant to get at the trait, but we know that no single question will measure the trait as well as a ruler measures height. So we combine a number of questions in hopes that the total from multiple questions will be a better measure than the score on any single question.
Measurement Validity • If the ‘score’ on the measure you use faithfully records a person’s ‘real’ position on or amount of the concept under study, then the measure is valid • Does your measure of ‘fear of technology’ really indicate the relative level of subjects on that concept? • Are other forces than ‘fear of technology’ determining subjects scores?
Validity is crucial • If your method of measurement is not valid, your whole research project is worthless • This is the reason careful explication (conceptualization, operationalization) is so important
Threats to validity • There are a great number of threats to measurement validity • They may come from: • The measures themselves • The administration of the measures • Anything from lighting in the room to the attitude exhibited by the interviewer • The subjects • How they approach the research
How to determine the validity of measures • Reliability—if the measure is reliable, there is greater reason to expect it to be valid • Tests of validity—a set of tests/approaches to determining measurement validity • Outcome of the research—if the results of the research resemble those predicted, there is greater support for the measures
Reliability • When a measurement procedure is reliable, it will yield consistent scores when the phenomenon being measured is not changing • If the phenomenon is changing, the scores will change in direct correspondence with the phenomenon
Reliability • Reliability is an estimate of the amount of non-systematic error in scores produced by a measurement procedure • Often considered a minimum level of (or “prerequisite for”) measurement validity • Schutt • Easier to measure than validity • Statistical estimates of reliability are available
Tests of reliability:Test-retest reliability • The same measure is applied to the same sample of individuals at two points in time • Example: Students are given the same survey to complete two weeks apart. The results for each respondent are compared. • Two weeks should not be so short that the respondents remember their answers to the questions nor so long that history and their own biological maturation should change their real scores
Tests of reliability:Interitem reliability • “When researchers use multiple items to measure a single concept, they must be concerned with interitem reliability (or internal consistency). • For example, if we are to have confidence that a set of questions . . . Reliably measures depression, the answers to the questions should be highly associated with one another. The stronger the association among the individual items and the more items that are included, the higher the reliability of the index. Cronbach’s alpha is a statistic commonly used to measure interitem reliability.”
Tests of reliability:Alternate forms reliability • Researchers compare subjects’ answers to slightly different versions of survey questions. • Reverse order of response choices • Modify question wording in minor ways • Split-halves reliability: survey sample is divided into two randomly. The two halves are administered the different forms of the questionnaire. If the outcomes are very similar, then the measure is reliable on this criterion.
Tests of reliability:Interobserver reliability • Multiple observers apply the same method to the same people, events, places or texts and the results are compared. • Most important when rating task is complex • Content analysis very commonly uses this method
Measurement Validity • Measurement validity addresses the question as to whether our measure actually is actually measuring what we think it is • We may actually be measuring something else or nothing at all
Evaluating measurement validity:Face validity • Careful inspection of a measure to see if it itseems valid—that it makes sense to someone who is knowledgeable about the concept and its measurement • All measures should be evaluated in this way. • Face validity is a weak form of validation. It is not convincing on its own.
Evaluating measurement validity:Content validity • Content validity is a means to determine whether the measure covers the entire range of meaning of the concept and excludes meanings not falling under the concept. • Compare measure to the view of the concept generated by a literature review • Have experts in the area review the measure and look for missing dimensions of concept or inclusion of dimensions that it should not
Evaluating measurement validity:Criterion validity • Compare scores on the measure to those generated by an already validated measure or the performance of a group known to be high or low on the measure • Concurrent validity: measure is compared to criterion at the same time • Predictive validity: scores on the measure are compared to future performance of subjects • Test of sales potential • Note: Many times proper criteria for test are not available
Evaluating measurement validity:Construct validity • Compare the performance of the measure to the performance of other measures as predicted by theory • Two forms: Convergent validity and Discriminant validity. Often combined in an analysis of construct validity
Convergent validity • Compare the results from your measure to those generated using other measures of the same concept • They should be highly correlated • Triangulation
Discriminant validity • Performance on the measure to be validated is compared to scores on different but related concepts. • Correlations to measures should be low to moderate. Too high a correlation indicates that either the concepts are not distinct or else your measure cannot tell them apart. Too low a correlation indicates that your measure does not measure your concept validly.
Outcome of the research:Theoretical performance • If your measure generates predictable statistical relationships with a number of measures of concepts you can make a stronger claim to the validity of the measure. • One would not expect either non-systematic nor systematic error variance to act in the way predicted from your theory/model
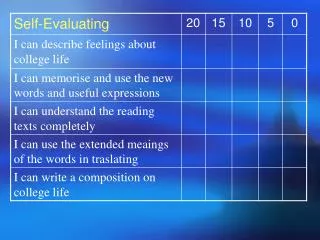
ReliabilityLow High V A High L I D I Low T Y