DOSE-EFFECT RELATIONSHIP
DOSE-EFFECT RELATIONSHIP. The intensity and duration of a drug’s effects are a function of the drug dose and drug concentration at the effect site Frank M. Balis, M.D. January 25, 2007. Monitoring Dose-Effect. Level Molecular (e.g, enzyme inhibition)

DOSE-EFFECT RELATIONSHIP
E N D
Presentation Transcript
DOSE-EFFECT RELATIONSHIP The intensity and duration of a drug’s effects are a function of the drug dose and drug concentration at the effect site Frank M. Balis, M.D. January 25, 2007
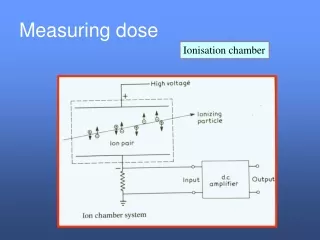
Monitoring Dose-Effect • Level • Molecular (e.g, enzyme inhibition) • Cellular (in vitro tissue culture, blood cells) • Tissue or organ (in vitro or in vivo) • Organism • Endpoint used to measure effect may be different at each level • Overall effect = sum of multiple drug effects and physiological response to drug effects
Dose-Effect Endpoints Graded • Continuous scale (dose®effect) • Measured in a single biologic unit • Relates dose to intensity of effect Quantal • All-or-none pharmacologic effect • Population studies • Relates dose to frequency of effect
Erythropoietin and Anemia Peak Hematocrit Increment [%] Erythropoietin Dose [units/kg] Eschbach et al. NEJM 316:73-8, 1987
Maximal effect • [Drug] Effect = KD + [Drug] Drug-Receptor Interactions Drug Drug-Receptor Complex Ligand-binding domain k1 Effector domain k2 Receptor Effect (KD = k2/k1)
[Drug] KD + [Drug] [Drug] Maximal effect Effect = KD + [Drug] Effect = Maximal effect if [Dose] >> KD Maximal effect • [Drug] Effect = KD + [Drug] Dose-Effect Relationship
Graded Dose-Effect Curve Maximal effect % of Maximal Effect EC50 [Drug]
Log Dose-Effect Curve % of Maximal Effect EC50 [Drug]
Lidocaine Graded Dose-Effect Analog Pain Score Lidocaine Blood Level [µg/ml] Ferrante et al. Anesth Analg 82:91-7, 1996
Theophylline Dose-Effect Relaxation % Control PDE Inhibition Theophylline [µM] Rabe et al. Eur Respir J 8:637-42, 1995
Metformin Dose-Response Decrease in FPG from Placebo [mg/dl] Decrease in HbA1c from Placebo [%] Dose [mg/d] Garber et al. Am J Med 102:491-7, 1997
Dose-Effect Parameters POTENCY: The sensitivity of an organ or tissue to the drug EFFICACY: The maximum effect
Maximal effect • [Drug] Effect = KD + [Drug] Comparing Dose-Effect Curves Drug A Drug B % of Maximal Effect Drug C [Drug]
Thiopurine Cytotoxicity Thioguanine Mercaptopurine Cytotoxic Effect Thiopurine [M] Adamson et al. Leukemia Res 18:805-10, 1994
Receptor-Mediated Effects % Maximum Effect [Drug]
Drug Interactions Agonist Agonist + competitive antagonist % of Maximal Effect Agonist + non-competitive antagonist [Drug]
Graded Dose-Effect Analysis • Identify the therapeutic dose/concentration • Define site of drug action (receptor) • Classify effect produced by drug-receptor interaction (agonist, antagonist) • Compare the relative potency and efficacy of drugs that produce the same effect • Assess mechanism of drug interactions
Quantal Dose-Effect Distribution ED50 # of Subjects Threshold Dose
Cumulative Dose-Effect Curve Cumulative % of Subjects Dose
Therapeutic and Toxic Effects Therapeutic Toxic % Responding ED99 TD50 TD1 ED50 Dose Indices
Doxorubicin Cardiotoxicity 1.0 0.80 0.60 Probability of CHF 0.40 0.20 0 0 200 400 600 800 1000 Total Doxorubicin Dose [mg/m2] von Hoff et al. Ann Intern Med 91:710-7, 1979
ED90 = 490 mg ED50 = 400 mg Lidocaine Quantal Dose-Effect % Achieving Complete Analgesia Total Lidocaine Dose (mg) Ferrante et al. Anesth Analg 82:91-7, 1996
Antihypertensive Dose-Effect Johnston Pharmacol Ther 55:53-93, 1992
Antihypertensive Drugs Desirable Dose Range Dose Range most often used % with Maximal Effect Adverse Effects Log Dose
Dose Intensity in Breast Cancer Response Rate (%) Relative Dose Intensity RDI Hryniuk & Bush J Clin Oncol 2:1281, 1984
Doxorubicin Dose in Osteosarcoma 100 80 60 % with >90% Necrosis 40 20 0 100 200 0 0 5 10 15 20 Dose Intensity (mg/m2/wk) Smith et al. JNCI 83:1460, 1993
Effect site Concentration Pharmacokinetics Pharmacodynamics Relating Dose to Effect In Vivo Dose Effect Age Absorption Distribution Elimination Drug interactions Tissue/organ sensitivity (receptor status)
Concentration and Effect vs. Time Non-Steady State Central Compartment Peripheral Compartment Conc./ Amount Effect [% of Emax] Effect Effect Compartment Time
Hysteresis and Proteresis Loops Intensity of Drug Effect Intensity of Drug Effect Hysteresis Loop (Counterclockwise) Proteresis Loop (Clockwise) • Equilibration delay in plasma and effect site conc. • Formation of active metabolite • Receptor up-regulation • Tolerance • Receptor tachyphylaxis Plasma Drug Concentration
Role of Dose-Effect Studies • Drug development • Site of action • Selection of dose and schedule • Potency, efficacy and safety • Drug interactions • Patient management • Therapeutic drug monitoring • Risk-benefit (therapeutic indices)
Endpoints to Monitor Drug Effect Farnesyltransferase Inhibitors for Cancer
TD50 TD1 ED50 ED99 = 1.3 Certain Safety Factor = TD1 - ED99 X 100 = 31% Standard Safety Margin = ED99 Therapeutic Indices Therapeutic Ratio = = 2.5
Dose • F AUC = Clearance Oral Mercaptopurine MP AUC [µM•hr] MP Dose (mg/m2) Balis et al. Blood 92:3569-77, 1998
Emax•[Drug]H Effect = EC50 + [Drug]H H Pharmacodynamic Models • Fixed effect model • Linear model • Log-linear model • Emax model • Sigmoid Emax model Effect = E0 + S•[Drug] Effect = I + S•Log([Drug])
Sigmoid Emax PD Model Effect (%) Effect (%) H = 5 H = 2 H = 1 H = 0.5 H = 0.1 EC50 EC50 [Drug]
Theophylline Pharmacodynamics FEV1 (% normal) Emax = 63% EC50 = 10 mg/L Theophylline [mg/L] Mitenko & Ogilvie NEJM 289:600-3, 1973
Carboplatin PK/PD % Decrease Platelet Carboplatin ClTB [ml/min] Creatinine Clearance [ml/min] Carboplatin AUC [µg•hr/ml] Van Echo et al. Semin Oncol 16:1-6, 1989
Carboplatin Adaptive Dosing ADULTS CHILDREN