Download
1 / 39
410 likes | 955 Vues
The Cause of Health Inequalities . The Black Report (1980). This was ground-breaking in that it identified a clear gap in health between the social classes. How might economic inequality affect health?.

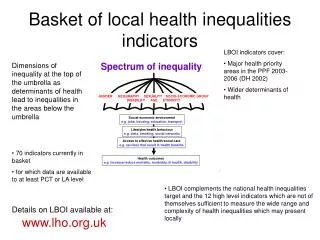
E N D
The Black Report (1980) This was ground-breaking in that it identified a clear gap in health between the social classes.
How might economic inequality affect health? In groups create a detailed mind-map demonstrating the ways in which economics might affect health and why.
Poverty, Social Class & Health Growing up in Scotland report: Poverty breeds ill-health See Next Slide http://www.heraldscotland.com/growing-up-in-scotland-report-poverty-breeds-ill-health-1.900474
Four-year-olds in deprived areas are more likely to have poor diets and be less active. • It showed 41% of children in poor areas had eaten a takeaway in the past week, compared with 23% of children in affluent areas. • It also showed that children who were breastfed generally had good health. • Mothers with more qualifications and affluent backgrounds were more likely to breastfeed their children. The above is a summary of the main points in the article.
Social Class Equally Well: Report of the Ministerial Task Force on Health Inequalities http://www.scotland.gov.uk/Publications/2008/06/25104032/0
Social Class- Diet There is now a higher degree of obesity in Scotland than anywhere except Mexico and the US. (The Herald 13 August 2010). http://news.bbc.co.uk/1/hi/health/8412796.stm Increase in junk food? Decrease in physical activity? What social classes are most affected? Summarise this article
Summarise the main statistics from the following article: http://news.bbc.co.uk/1/hi/scotland/8384429.stm
Social Class - Alcohol An increase in drinking among middle-age and older groups. Stressful jobs? Can afford to do it?
Scots 'drink 46 bottles of vodka'http://news.bbc.co.uk/1/hi/8463333.stm • Adults in Scotland are drinking the equivalent of 46 bottles of vodka each in a year, a study has suggested. • People in Scotland drank 25% more alcohol per head of population than individuals in England and Wales, the figures suggested. http://www.heraldscotland.com/scots-eighth-on-alcohol-consumption-world-league-table-1.903359
Social Class - Smoking Smoking is seen by many as a ‘coping mechanism’, a little pleasure in what may be a thoroughly depressing existence. That might explain why the lower social classes tend to smoke more than the professional classes. The irony is, they are the ones who can’t really afford to smoke. This could tie in with the high proportion of Bangladeshi men who smoke as they are also the most deprived ethnic group.
Clearly, the number of people smoking is declining, however, the lower social classes are still far more likely to smoke. Smoking accounts for almost a quarter of all deaths in Scotland.
In 2005, 52% of adults aged 25-49 with no qualifications smoked compared with 16% amongst those with a Degree.
Social Class – Increased Wealth Rich, fatty foods. Ability to eat out more often – no control over calorie count
Social Class – Lifestyle Choices Do you choose to eat McDonald’s and take-aways more/less often because of your social status?
The Acheson Report (1998) ‘They were unhealthy. They did not live as long and they suffered more from lung cancer, coronary heart disease, strokes, suicide and violent accidents than their richer peers. These inequalities had steadily worsened over the preceding twenty years. They were more likely to have their cars stolen and their homes vandalised. They ate less iron, calcium, dietary fibre and vitamin C. They were fatter’.
Geography – Life Expectancy Calton & Lenzie http://www.youtube.com/watch?v=-icKkIO2HCw
Separated by only a few miles, Calton and Lenzie could not be any further apart. With a life expectancy gap of 28 years, what has caused this? Consider some of the other factors we’re looking at – they all apply. http://news.scotsman.com/glasgow/-If-you-are-born.4439094.jp
http://www.bbc.co.uk/learningzone/clips/lifestyle-choices/5079.htmlhttp://www.bbc.co.uk/learningzone/clips/lifestyle-choices/5079.html Video Clip Geography – Lifestyle Choices Alcohol Consumption - Drug Use - Diet - Exercise – is gym membership now a ‘middle-class’ hobby?
Geography - Unemployment Clearly, certain parts of the country have been affected quite significantly by the recession and unemployment. There’s a link between unemployment and health. http://www.tuc.org.uk/economy/tuc-17402-f0.pdf See Next Slide
The Social Exclusion Task Force evidence includes research that shows problems in all these areas: • Unemployment increases the risk of marital dissolution by 70%. • Studies in a number of countries have shown that losing one’s job can trigger problem drinking for 1 in 5 men and 2 in 5 women. • The evidence of a link between unemployment and suicide is particularly strong. • The Samaritans have described emotional health issues as the “hidden face” of the recession and at the end of 2008 warned that “the deepening financial and economic crises could lead to an increase in suicide rates nationwide as people face unemployment, mounting debt and housing insecurity. http://www.tuc.org.uk/economy/tuc-17402-f0.pdf
Geography – Access to healthy food Deprived areas tend to be dominated by poor quality shops that lack fruit and vegetables and often supply low cost ‘ready meals’ that are high in calories, saturated fats and salt.
Geography - Healthcare Provision Access to healthcare is not the same throughout the country. The term ‘postcode lottery’ refers to restricted access to certain treatments depending upon where you live. For example, access to the cancer drug Avastin. Also, access to health services such as a Doctor’s or Dentist’s Surgery may not be close enough and transport could be an issue.
Where you live can have a huge impact on the level of healthcare provision you receive. The term ‘Postcode Lottery’ refers to the availability of certain treatments dependent on where you live. The table below demonstrates how cancer survival rates fluctuate throughout the UK in 2010. http://www.dailymail.co.uk/health/article-1288282/Map-UK-cancer-survivors-shows-record-numbers-Britons-living-disease.html
Age Clearly, the elderly are more likely to encounter health problems, than those significantly younger than them. What illnesses/health issues would we typically associate with age?
Age and Smoking Smoking rates tend to decrease with age
Race What role does race play in terms of health?
Increased risk of rickets http://news.bbc.co.uk/1/hi/health/8570542.stm • Black Caribbean men have a much higher risk of stroke • The publication, Ethnic Differences in Cardiovascular Disease 2010, reports that 27% of deaths in men born in South Asia and living in the UK are from heart disease, compared with 18% in men born in the UK.
in 2005, infant mortality in both the Pakistani and Caribbean groups was twice that of the White British group. • Asian and Black ethnic groups accounted for over 11 per cent of live births in England and Wales in 2005, and 17 per cent of infant deaths. • Babies in the Pakistani and Caribbean groups had particularly high infant mortality rates, 9.6 and 9.8 deaths per 1,000 live births respectively. This was double the rate in the White British group of 4.5 deaths per 1,000 live births.
Race - Smoking Smoking amongst ethnic minorities is higher than it is amongst whites and there may be a cultural aspect to this. On average, around 22% of White people smoke in the UK. http://info.cancerresearchuk.org/cancerstats/types/lung/smoking/
Smoking amongst ethnic minorities is higher than it is amongst whites and there may be a cultural aspect to this. On average, around 22% of White people smoke in the UK.
Race - Alcohol Most minority ethnic groups have higher rates of abstinence and lower levels of drinking compared to people from white backgrounds. Abstinence is high amongst South Asians, particularly those from Pakistani, Bangladeshi and Muslim backgrounds. But Pakistani and Muslim men who do drink do so more heavily than other non-white minority ethnic and religious groups. People from Indian, Chinese, Irish and Pakistani backgrounds on higher incomes tend to drink above recommended limits. http://www.jrf.org.uk/sites/files/jrf/ethnicity-alcohol-literature-review-summary.pdf
Race - Poverty We already know there’s a clear link between race and poverty. What impact does poverty have on health? Video Clip http://www.bbc.co.uk/learningzone/clips/summary-of-health-inequalities-in-the-uk/5080.html
Gender – Life Expectancy Life expectancy of women in the UK is 82 and men 78. Is this because men currently at this age are more likely to have worked longer and in more physically demanding jobs. Many women would not have worked in order to look after their family, although this is changing. Can you think of any physically demanding jobs that men would do that women are less likely to?
Gender – Alcohol An increase in drinking amongst women This may be a result of increased advertising, more women working and increased independence. The proportion of women who binge-drink almost doubled between 1998 and 2006 Video Clip http://www.bbc.co.uk/learningzone/clips/alcohol-and-binge-drinking-the-harmful-effects/6028.html http://www.jrf.org.uk/media-centre/alcohol-trends-in-britain
However, women are more likely to ‘binge drink’ in the younger age group.
Gender – Men Less Likely to Consult Doctor Men are less likely to consult a doctor than women. Why? Pride Ignorance Embarassment Culturally unacceptable