Download
1 / 53
540 likes | 669 Vues
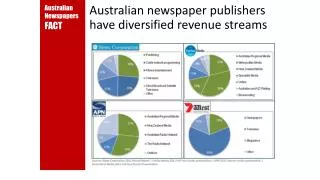
This presentation discusses the critical balance between water conservation efforts and revenue generation for utilities. It highlights the high fixed costs associated with water utilities and the impact of conservation measures on overall finances. Key topics include pricing strategies that influence customer behavior, the elasticity of demand for water, and various rate structures such as declining block, seasonal rates, and water budget-based pricing. It emphasizes the need for effective communication and planning to ensure sustainable water management practices while meeting financial objectives.

E N D
Balancing Conservation and Revenue Streams Carol Malesky, Red Oak Consulting JTAC Presentation, February 22nd, 2007
Rate Making Standards • American Water Works Association • Environmental Protection Agency • Water Environment Federation • Public Utility Commissions
Water Utility Cost Structure • Fixed costs are high • Fixed costs are typically 80-95% of total annual costs • E.g., labor, debt service, etc. • Variable costs are low • E.g., power, chemicals, etc.
Impact of Curtailment and Conservation on Finances • You may lose revenues • Mix of customers and other factors affect reductions in water sales • Revenue losses depend on structure of charges (i.e., fixed charges vs. volume charges) • You may experience increased costs • Curtailment programs • Enforcement of water use restrictions • Cost of alternative sources
Common Conservation/Curtailment Tools • Water restrictions • Public education/awareness • Xeriscaping • Fixture replacement/credits • “Water police” • Surcharges • Rates
Rates As a Tool in the Conservation Arsenal • Rates as a price signal • Price elasticity of demand • Volume rates vs. fixed charges
Customers React to Perceived Price • Water bill • Highest block rate • Clarity of bill is important
Changes in Demand Partially Depend on Perceived Price • Customers rarely know the marginal price • Literature suggests that people respond to a mixture of both marginal and average price • Peoples’ perceived prices can be altered • Other factors influence changes in demand
Impact of Price on Customers • Price elasticity of demand • Measures change in demand from a change in price • Price elastic—Demand decreases more than increases in price (e.g. e = -1.25) • Price inelastic—Demand decreases less than increases in price (e.g. e = -0.25)
Price Elasticity Concepts • Water is relatively inelastic • Elasticity in residential demand varies: • Outdoor use is more elastic than indoor use • Peak use is more elastic than off-peak use • Factors other than price affect elasticity (e.g. public information, values, geography, climate) • Commercial/industrial elasticity is generally higher than residential
Price Elasticity Applied • Residential elasticity falls between–0.1 and –0.3 nationally (AWWA) • 5% increase in price could reduce demand by 0.5% to 1.5% • Commercial/industrial elasticity can be as high as –0.8 (AWWA) • 5% increase in price could reduce demand by as much as 4%
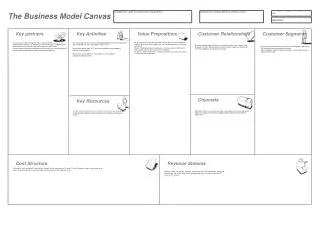
Choosing a Rate Design • Often a distinct effort, separate from finance planning and cost-of-service study • Links cost of service to one or more alternative rate structures • Matches community needs with rate structure • Follow a correct processto evaluate rate structures
Examples of Alternative Rate Structures • Flat rate • Declining block • Uniform rates • Inclining block • Excess-use • Seasonal
Common Conservation Rate Structures • Seasonal rates • Inclining block rates • Excess-use rates • Water budget-based rates
Seasonal Rates • Lower rates in off-peak months (e.g. October – May) • Higher rates in the summer, or peak months • Price signals are seasonal
Inclining Block Rates • Rates increase at increasing levels of water use • Blocks are established at various levels • Block thresholds • By Class • By Meter Size • Common rate structure with flexibility to send various price signals
Excess-Use Rates • Lower rate charged for average level of use (e.g. average winter use) • Higher rates charged for use over the established average winter water use • Price consistent throughout the year
Water Budget-Based Rates • Each account is given a monthly water budget based on landscaped area • Monthly budget = indoor allotment and irrigation allotment • Blocks are often based on percentage of use over budget • Rates are often based on multiples of a Base rate
Conservation Pricing - Issues/Concerns • Lost Revenue – Plan Accordingly • Budget and financial objectives based on “normal” year, plan minimum against “worst case” year • Revenue effects of drought curtailment predictable • Plan for customer response • Fund long-term conservation programs • Implementation Issues • Avoid rate shock • Phase-in rate increases • Better customer communication gives customers time to adapt their consumption
Conservation Pricing - Issues/Concerns, cont’d • Once Size Does Not Fit All • A single rate structure may not work for all classes of service • One class may have large variations in size and uses • Conservation rate structures are potentially viewed by customers as punitive • Customer’s ability to modify behavior/usage may vary
Case Study Tualatin Valley Water District 2005 Water Rate Study
Steps in Developing Board Consensus • Overview of rate making and conservation rates • Develop rate design goals and objectives • Develop Board evaluation criteria • Narrow list of alternatives for further analysis using pros and cons • Detailed evaluations using Board criteria (first use of quantitative evaluations) • Final recommendation
Board’s Goals and Objectives • Encourage conservation by establishing blocks that are more relevant to customer use • Ensure interclass equity by providing adequate distinction among customer classes • Reduce peak-season and peak-day use • Insulate TVWD from wholesale rate spikes • Ensure weather-sensitive financial stability • Maintain customer acceptance • Provide a low-cost, entry-level block that is based on cost of service • Keep it simple
Previous Rate Structure • Single-family residential and irrigation: 2 blocks • Blocks vary by meter size • Large commercial (i.e., Production) • 1 block for all consumption • Priced at block 1 rate • Multifamily and commercial • 2 block excess-use rate • Block thresholds at 140 percent of annual average water consumption • Moving average of annual consumption • Average winter consumption more common for excess-use rates
Preliminary Observations of TVWD’s Previous Rate Structure • Block thresholds were too high • Volume charges were too low • Fixed charges were too high • Irrigation customers appeared to pay less than the current cost of service • Annual average consumption less effective than average winter consumption
Rate Design Alternatives • Status Quo: Existing rate structure • Scenario A: Reduced thresholds • Single-family residential: Inclining 2 block • Others: Excess-use 2 block • Scenario B: Excess-use rates • Single-family residential: Excess-use 3 block • Others: Excess-use 2 block • Scenario C: Three blocks • Single-family residential: Inclining 3 block • Multifamily and commercial: Excess-use 3 block • Irrigation: Uniform • Scenario D: Three block SFR, 2 blocks other • Single-family residential: Inclining 3 block • Multifamily and commercial: Excess-use 2 block • Irrigation: Uniform
Recommendation • Board selected Scenario A • Closely monitor revenues as customers adjust to new rates • Make annual adjustments as necessary • Integrate rate design with other conservation efforts • Review conservation objectives and rate design in 3 years
Other Considerations • Changing too many elements at once • Allowing sufficient time to see how new rate structure will play out • Monitor revenues • Communication plan • Bill stuffers and direct mailings • Bill re-design • Website info • Public meetings • Cross-price elasticity with wastewater
Case Study Albuquerque Bernalillo County Water Utility Authority 2004 Water Rate Study
Albuquerque Bernalillo County Water Utility Authority • Authority created by State of New Mexico from City water and wastewater utilities to serve both City and Bernalillo County • Board consists of City Councilors and County Commissioners with Board Chairman • Rate study authorized in 2003 by City included a request to review water rate structure
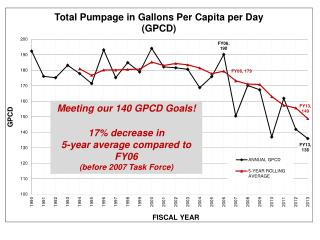
ABCWUA’s Goals and Objectives • Encourage water conservation to help meet goal of 40 percent reduction by 2014 • Ensure financial stability of ABCWUA • Follow cost-of-service principles • Maintain implementation and administrative ease • Maintain customer and political acceptance • Minimize impact on customers
Steps in the Process • Identify community goals • Develop evaluation criteria based on goals • List rate structure alternatives • Conduct preliminary evaluation (qualitative) to narrow alternatives to three for further analysis • Quantitatively analyze alternatives with cost-of-service and conservation impact models • Fully evaluate rate structure alternatives (qualitative and quantitative)
Rate Structure Alternatives Analyzed • Scenario A: Existing seasonal excess-use rate structure that incorporates updated COS rates; residential customers with smaller meters are assigned average winter water consumption (AWC) of meter size • Scenario B: Similar to current structure; individual AWC for each account • Scenario B2: Individual AWC with fixed monthly charge that recovers annual debt service and customer service & meter costs • Scenario C: Lifeline block for all residential customers with low income subsidy for qualifying accounts • Scenario D: Water budget-based usage thresholds; fixed monthly charge recovers customers service & meter costs
Tool for Rate Structure Evaluation • Conservation Impact Model • Allows quantitative analysis of rate structures • Characterizes monthly water consumption by meter size and customer classification • Allows changes in rates, block thresholds, and revenue requirements • Provides estimates of water conservation • Assumptions used • Price elasticity of demand • Statistical distributions of customer demand • Rate structure characteristics
Committee Input • Technical Advisory Committee (TAC) • Comprised of Authority Staff and County representative • Involved in evaluation process from beginning • Assisted in improving final rate structure recommended for adoption • Water Resource Advisory Committee (WRAC) • Resolution for formation authorized its involvement in rate structure selection • Analysis had been completed before its first meeting • WRAC involvement became educational process
Moving Toward an Acceptable Rate Structure • Conservation Goals • More revenues collected through commodity rates • Steeper blocks/rate tiers to penalize higher water use • Revenue stability goals • More revenues collected through the fixed monthly charge • Blocks/tiers that target higher consumption
Final Rate Structure • Implemented rate structure alternative that balanced conservation with revenue stability • Recovers debt service, customer service & billing costs through fixed monthly charge • Targets excess consumption through seasonal excess-use surcharges
Conclusions • Follow a formal evaluation process • Involve advisory committees early in process • Select evaluation criteria that balance community goals • Ultimately, selection of most appropriate rate structure lies with policy makers