
Descriptive Statistics
Explore descriptive statistics using data from movies and international telephone calls. Learn how to calculate sample mean, quartiles, median, IQR, and identify outliers through histograms and boxplots.

Descriptive Statistics
E N D
Presentation Transcript
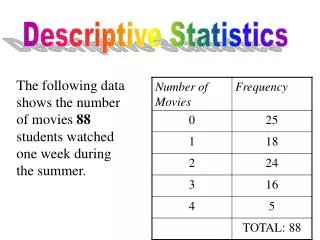
Descriptive Statistics The following data shows the number of movies 88 students watched one week during the summer.
Descriptive Statistics Data must be entered into your calculator. • The median • The third quartile • The IQR • Calculate: • The sample mean • The first quartile
Descriptive Statistics Data must be entered into your calculator. • Histogram • Default • Set Window • Graph: • Boxplot • Default
Descriptive Statistics The following data shows the lengths (in minutes) of 64 international telephone calls using a prepaid calling card.
Descriptive Statistics • Calculate: • The sample mean • The sample standard deviation • The first quartile • The median • The third quartile • The IQR
Descriptive Statistics • Plot: • Boxplot • Histogram
Descriptive Statistics • Does the histogram of this data appear to be • Skewed right? • Skewed left? • Symmetrical?
Descriptive Statistics • Are their any potential outliers (values that do not seem to “fit” the rest of the data)? • Are there any values 1.5*IQR above Q3? • Are there any values 1.5*IQR below Q1? • Potential Outliers require further investigation.
Descriptive Statistics • 1.5*IQR = 1.5*(Q3-Q1) = 1.5*(24-4) = 30 • Are there any values 1.5*IQR above Q3? • Q3 + 1.5*IQR = 24 + 30 = 54 • NO. The largest value is 54. • Are there any values 1.5*IQR below Q1? • Q1 – 1.5*IQR = 4 – 30 = - 26 • NO. The smallest value is 4.


