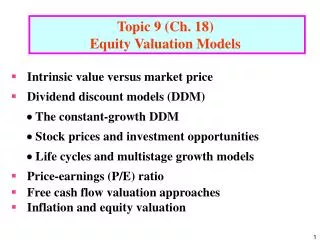
Equity Valuation Models
Equity Valuation Models. Lectured by Chandra Wijaya. Models of Equity Valuation. Basic Types of Models Balance Sheet Models Dividend Discount Models Price/Earning Ratios Estimating Growth Rates and Opportunities. Limitations of Book Value.


Equity Valuation Models
E N D
Presentation Transcript
Equity Valuation Models Lectured byChandra Wijaya
Models of Equity Valuation • Basic Types of Models • Balance Sheet Models • Dividend Discount Models • Price/Earning Ratios • Estimating Growth Rates and Opportunities
Limitations of Book Value • Book value is an application of arbitrary accounting rules • Can book value represent a floor value? • Better approaches • Liquidation value • Replacement cost
Intrinsic Value and Market Price • Intrinsic Value • Self assigned Value • Variety of models are used for estimation • Market Price • Consensus value of all potential traders • Trading Signal • IV > MP Buy • IV < MP Sell or Short Sell • IV = MP Hold or Fairly Priced
Dividend Discount Models: General Model V0 = Value of Stock Dt = Dividend k = required return
No Growth Model Stocks that have earnings and dividends that are expected to remain constant. Preferred Stock
No Growth Model: Example E1 = D1 = $5.00 k = .15 V0 = $5.00 / .15 = $33.33
Constant Growth Model g = constant perpetual growth rate
Constant Growth Model: Example E1 = $5.00 b = 40% k = 15% (1-b) = 60% D1 = $3.00 g = 8% V0 = 3.00 / (.15 - .08) = $42.86
Estimating Dividend Growth Rates g = growth rate in dividends ROE = Return on Equity for the firm b = plowback or retention percentage rate (1- dividend payout percentage rate)
Specified Holding Period Model PN = the expected sales price for the stock at time N N = the specified number of years the stock is expected to be held
Growth & No Growth Components of Value PVGO = Present Value of Growth Opportunities E1 = Earnings Per Share for period 1
Partitioning Value: Example ROE = 20% d = 60% b = 40% E1 = $5.00 D1 = $3.00 k = 15% g = .20 x .40 = .08 or 8%
Partitioning Value: Example Vo = value with growth NGVo = no growth component value PVGO = Present Value of Growth Opportunities
Price Earnings Ratios • P/E Ratios are a function of two factors • Required Rates of Return (k) • Expected growth in Dividends • Uses • Relative valuation • Extensive Use in industry
P/E Ratio: No Expected Growth • E1 - expected earnings for next year • E1 is equal to D1 under no growth • k - required rate of return
P/E Ratio with Constant Growth b = retention ratio ROE = Return on Equity
Numerical Example: No Growth E0 = $2.50 g = 0 k = 12.5% P0 = D/k = $2.50/.125 = $20.00 PE = 1/k = 1/.125 = 8
Numerical Example with Growth b = 60% ROE = 15% (1-b) = 40% E1 = $2.50 (1 + (.6)(.15)) = $2.73 D1 = $2.73 (1-.6) = $1.09 k = 12.5% g = 9% P0 = 1.09/(.125-.09) = $31.14 PE = 31.14/2.73 = 11.4 PE = (1 - .60) / (.125 - .09) = 11.4
Pitfalls in P/E Analysis • Use of accounting earnings • Historical costs • May not reflect economic earnings • Inflation • Reported earnings fluctuate around the business cycle.
Other Valuation Ratios • Price-to-Book • Price-to-Cash Flow • Price-to-Sales
Inflation and Equity Valuation • Inflation has an impact on equity valuations. • Historical costs underestimate economic costs. • Empirical research shows that inflation has an adverse effect on equity values. • Research shows that real rates of return are lower with high rates of inflation.
Lower Equity Values with Inflation • Shocks cause expectation of lower earnings by market participants. • Returns are viewed as being riskier with higher rates of inflation. • Real dividends are lower because of taxes.
Free Cash Flow Approach • Discount the free cash flow for the firm • Discount rate is the firm’s cost of capital • Components of free cash flow • After tax EBIT • Depreciation • Capital expenditures • Increase in net working capital
Categories of Stock Blue chip stock Income stocks Cyclical stocks Defensive stocks Growth stocks Speculative stocks Penny stocks
Categories of Stock Blue Chip Stock • Blue chip has become a colloquial term meaning “high quality” • Some define blue chips as firms with a long, uninterrupted history of dividend payments • The term blue chip lacks precise meaning, but some examples are: • Coca-Cola • Union Pacific • General Mills
Categories of Stock Income Stocks • Income stocks are those that historically have paid a larger-than-average percentage of their net income as dividends • The proportion of net income paid out as dividends is the payout ratio • The proportion of net income retained is the retention ratio
Categories of Stock Cyclical Stocks Cyclical stocks are stocks whose fortunes are directly tied to the state of the overall national economy Examples include steel companies, industrial chemical firms, and automobile producers
Categories of Stock Defensive Stocks • Defensive stocks are the opposite of cyclical stocks • They are largely immune to changes in the macroeconomy and have low betas • Examples include retail food chains, tobacco and alcohol firms, and utilities
Categories of Stock Growth Stocks • Growth stocks do not pay out a high percentage of their earnings as dividends and may be good candidates for above-average returns. • They reinvest most of their earnings into investment opportunities • Many growth stocks do pay dividends
Categories of Stock • A speculative stockhas a high probability of a loss and a small probability of a large profit. Most speculative stocks are relatively new companies with representation in the technology, bioresearch, and pharmaceutical industries • Penny stocks refer to unusually risky, especially inexpensive shares. Penny stocks sell for $1 per share or less
Categories of Stock Categories Are Not Mutually Exclusive • An income stock or a growth stock can also be a blue chip • E.g., Potomac Electric Power • Defensive or cyclical stocks can be growth stocks • E.g., Dow Chemical is a cyclical growth stock