Download
1 / 5
50 likes | 175 Vues
This report, conducted by Acxiom, analyzes resident migration patterns in and around Warwickshire as of January 2010. It examines the movement of households between Local Super Output Areas (LSOAs), using both stringent and relaxed definitions provided by Warwickshire County Council. The analysis categorizes LSOAs into Transit, Escalator, Isolate, and Gentrifier based on economic shifts. Additionally, findings include thematic mapping of migration hotspots, showcasing areas of significant in and outflows, and detailing the quality of areas being moved to or from.

E N D
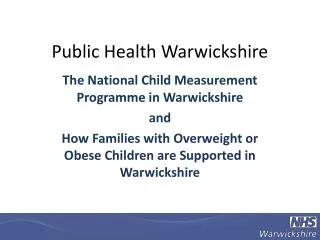
Warwickshire Migration Analysis January 2010
Warwickshire Migration - Summary • Acxiom used it’s own data to track the movement of residents to, from and within Warwickshire. • The results in this analysis focused on anyone who has either: • Moved from an LSOA outside of Warwickshire, to an LSOA within Warwickshire. • Moved from an LSOA within Warwickshire, to an LSOA outside of Warwickshire. • Moved between LSOA’s within Warwickshire • Acxiom used both the stringent and relaxed definitions provided by Warwickshire CC to define each of the 530 Super Output Areas. • Based upon the movement of households into less deprived, similarly deprived or more deprived areas, each SOA was defined as either Transit, Escalator, Isolate and Gentrifier. • Warwickshire CC provided Acxiom with both the stringent and relaxed definitions. • It was not always possible to assign every LSOA to one of the four pre-defined parameters. Stringent Definition Counts Relaxed Definition Counts
Warwickshire Migration - Results Below is a snapshot of the full data file that will be provided back to Warwickshire CC. Due to the “relaxed “parameters allowing for a far greater number of LSOA’s to be defined, we have used these as opposed to the “stringent” parameters in order to categorise our LSOA’s. Variable Name Descriptions In Movers:IB, IS and IW represent whether the LSOA they have moved “into” is better, similar or worse than that they have just left. Out Movers: OB, OS and OW represent the percentage of people that move “out” to an LSOA that is better, similar or worse. In/Out Ratio: See above definition in ”Key” box. LSOA Type: Using the “relaxed” rules, this represents the migration classification for each LSOA.
Warwickshire Migration – In/Out Hotspots This map is a way of showing the general flow of in/out migration in the Warwickshire region – highlighting any hotspots. We have thematically mapped the in/out ratio as defined from slide 2. Note that we used the “relaxed” definition rules in this case. As a reminder: Ratio > 1.0 = In-Movement greater than Out-Movement Ratio < 1.0 = Out-Movement greater then In-Movement