Download
1 / 10
100 likes | 239 Vues
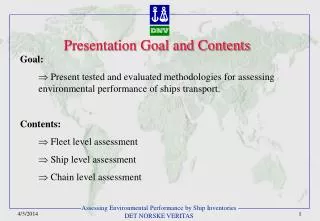
Presentation Goal and Contents. Goal: Present tested and evaluated methodologies for assessing environmental performance of ships transport. Contents: Fleet level assessment Ship level assessment Chain level assessment. World fleet exhaust gas emissions -equation.

E N D
Presentation Goal and Contents • Goal: • Present tested and evaluated methodologies for assessing environmental performance of ships transport. • Contents: • Fleet level assessment • Ship level assessment • Chain level assessment
World fleet exhaust gas emissions -equation • Emissions are estimated for 9 ship type categories which are summarised. • Ship type fleet size is found from Lloyd’s World Fleet Statistics 1996. • Ship type emissions are calculated based on: • engine type distribution (SS, MS, HS, TM) -from 4500 DNV classed vessels • average installed engine power (not aux. engines) -from 4500 DNV classed vessels • average fuel consumption for each engine type (kg fuel/kWh) -from literature • average engine load -from expert assumption • annual operating hours -from interviews and literature • engine type dependent emission factors -from DNV/Marintek/Lloyds.
World fleet exhaust gas emissions -results (1) The total figures for carbon (C), sulphur dioxide (SO2) and nitrogen oxides (NOx) from other studies correspond fairly well with our estimate. CO2 emissions constitutes 2% of global emissions, SO2 about 5% and NOx about 7%.
World fleet exhaust gas emissions -results (2) • The results provides reference values in analysis of technical and operational solutions for fleet segments (ships types and/or size categories). This enable cost/benefit analysis to be performed to assess pollution reduction measures. • For an overall cost/benefit analysis a benefit indicator must be selected. A society cost indicator is applied by weighting the emissions based on their respective cost factors. Two methods are applied -ExternE and EPS.
Ship life cycle emissions -system Natural resources Total system Ship Life Cycle Waste treatment chain Energy and materials Production chain Building Waste Operation Maintenance Scrapping Emissions
Ship life cycle emissions -35000 grt Ro-Ro case Scrapping Maintenance Operation Building Contribution to total Fos. CO2 NOx SOx CO CxHy PM TBT Wst.
Transport chain emissions -passenger case means and route 120 km aircraft and 6 km taxi 160 km high speed light craft 230 km car and 55 km ferry
Transport chain emissions -passenger case results HSLC system Aircraft system Car system Land Noise Fuel CO2 NOx SOx CO CxHy PM
Transport chain emissions -passenger case conclusions • Ship based transport chains perform well compared to available alternatives, but has less good performance with respect to NOx and SOx emissions. Applying gas turbines will lower the NOx and SOx emissions to the level of alternative transport means. • The biggest improvement potential for passenger transport chains (in Northern Norway) lies in increasing the exploited capacity. • Operational modes for the transport means should be taken into account as they have a significant influence on the results. Especially for transport means with intermediate stops between total route start and stop. • The main methodological challenge is allocation of environmental burdens between different passengers and cargo when a transport mean transports both. A harmonised methodology is recommended developed. Economic (e.g. annual turnover) for cargo and passengers appear to be the best basis for allocation. • Main data challenge is to derive specific exploited capacities and emission factors.