Managing Inventory
Managing Inventory. Module V. TYPES OF INVENTORY. Manufacturing Inventory. Raw Material. Work-In-Process. Maintenance Repair Operating Supplies. Distribution Inventory. Finished Goods. Saleable Spares. Echelon Inventory. Total Supply Chain Inventory

Managing Inventory
E N D
Presentation Transcript
Managing Inventory Module V
TYPES OF INVENTORY • Manufacturing Inventory • Raw Material • Work-In-Process • Maintenance Repair Operating Supplies • Distribution Inventory • Finished Goods • Saleable Spares • Echelon Inventory Total Supply Chain Inventory Multi- Echelon Inventory
Supplier Echelon Lead time Factory Echelon Lead time Depot Echelon Lead time Suppliers Supplier Echelon Inventory Receiving Stores Holding Stores Plant Plant Plant Plant FPS Factory Echelon Inventory Depot Dealer Dealer Dealer Dealer MULTI-ECHELON INVENTORY Depot Echelon Inventory
INVENTORY MANAGEMENT • Inventory Management Comprises • Inventory Planning • Inventory Control • Inventory Created By Production Also Supports it & Needs to be Managed Together in a Coordinated Way (Not Separately) • Inventory Planning Carried Out at All Levels of Management • Master Planning Level – End Products • Overall Inventory Level • Production Planning – Overall Company • Master Production Scheduling (MPS) – End Items/ Finished Goods • Material Requirement Planning (MRP) – Components/ Parts/ Raw Material • Value of Inventory Converts into Cash as Inventories Used by Operations Resulting in improved Cash Flow/ Return on Investment • Carrying Inventory Absorbs Costs Increasing Operating Costs & Decreasing Profits • Good Inventory Management Essential for Profitable Running of Any Organization
LEVELS OF INVENTORY MANAGEMENT • Aggregate Inventory Management • Manage Inventory as Per Classification & Functions They Perform • Raw Material • Work-in-Process • Finished Goods • Financially Oriented & Concerned with Costs & Benefits of Carrying Different Classifications of Inventory • Aggregate Inventory Management Looks into • Flow & Kinds of Inventory Needed • Supply & Demand Patterns • Functions that Inventories Perform • Objectives of Inventory Management • Inventory Costs • Item-Level Inventory Management Involves Establishing Decision Rules for Controlling Inventory at the Item Level & Includes • Identifying Items Most Important for Business • How Individual Items Will be Controlled • How Much to Order at One Time • When To Place an Order
INVENTORY CLASSIFICATION BY FLOWS • Major Classification of Inventory Based on Flow of Material Into/ Through and Out of a Manufacturing Organization • Raw Material – Purchased Items Received But Not Issued to Production & Include Component/ Parts/ Sub-assemblies • Work-In-Process (WIP) - Raw Materials Issued to Production Being Processed/ Waiting for Next Stage in Processing • Finished Goods – End Product of the Production Process Ready for Sale Held at Factory/ Central Warehouse • Distribution Inventories – Stocked in Various Points in the Distribution System • Maintenance, Repair & Operational Supplies (MRO) – Items that Support the Production Process But Do Not Become Part of Product – Hand Tools/ Machine Spares/ Lubricants/ Cleaning Supplies C U S T O M E R S Warehouse Supplier Raw Materials Purchased Parts Sub-Assemblies Work In Process Finished Goods Warehouse Supplier Warehouse Supplier Inventories/ Flow of Materials
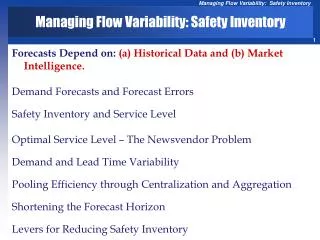
FUNCTIONAL VIEW OF INVENTORY • Anticipation Inventory • In Anticipation of Future Demand Ahead of Peak Selling Season/ Sales Promotion/ Vacation Shutdown/ Threat of Strike • Fluctuation Inventory (Safety Stock) • To Cover Random Unpredictable Fluctuations in Supply/ Demand/ Lead Time • Safety Stock/ Buffer Stock/ Reserve Stock Prevents Disruption in Manufacturing/ Deliveries To Customers Due To Stock Out Resulting from Un-Anticipated Delays • Lot-Size Inventory (Cycle Stock) • Purchased/ Manufactured Quantities Greater Than Immediate Need Create Cycle Stock • To Take Advantage Of Quantity Discounts/ Reduce Shipping/ Set Up Costs • When Making/ Purchasing of Items at Rate Same as These Will Be Used/ Sold • Cycle Stock is Portion of Inventory That Depletes Gradually as Customer Order Comes in and is Replenished Cyclically When Suppliers Deliver Supplies • Maintenance, Repair & Operating Supplies (MRO) • Items that Support the Production Process But Do Not Become Part of Product – Hand Tools/ Machine Spares/ Lubricants/ Cleaning Compounds/ Pencils/ Erasers
FUNCTIONAL VIEW OF INVENTORY • Hedge Inventory • Inventory Procured To Take Benefit of Low Prices When Supply More Than Demand in Global Markets • Such Products Normally are Minerals/ Grains/ Animal Products • Transportation Inventory (Pipeline/ Movement Inventory) • Inventory in Transit • Created as Time Required to Move Inventory from Plant To Distribution Centre/ Customer • Transit Inventory Not Dependent on Shipment Size But on Transit Time-T, in Days & Annual Demand-A, in Units • Average Annual Inventory in Transit, I=TA/ 365 in Units • Reduction in Annual Average Transit Inventory Possible by Reducing Transportation Time Delivery of goods from a supplier is in transit for ten days. If the annual demand is 4, 200 Units, what is the Average Annual Inventory in Transit? Average Annual Inventory in Transit, I = TA/ 365 = (10×4200)/ 365=115.06 Units
EXAMPLES • Delivery of goods from a supplier is in transit for twelve days. If the annual demand is 5, 500 Units, what is the Average Annual Inventory in Transit? Average Annual Inventory in Transit, I = TA/ 365 = (12×5500)/365=180.82 Units • If Transit Time is eleven days and the Annual Demand for an item is • 10, 000 Units. What is the Average Annual Inventory in Transit? Average Annual Inventory in Transit, I = TA/ 365 = (11×10000)/365=301.36 Units • A company is using a carrier to deliver goods to a major customer. Annual demand is Rs 2,000,000 and the average transit time is 10 days. Another carrier promises delivery in 7 days. What will be the reduction in transit inventory if the company accepts the offer? Current Average Annual Inventory in Transit= TA/ 365 = (10×2000000)/365=Rs 54,794.52 If offer Accepted, Average Annual Inventory in Transit= TA/ 365 = (7×2000000)/365=14000000/365= Rs. 38,356.16 Reduction in transit inventory= 54, 794.52-38, 356.16=Rs. 16, 438.36
INVENTORY MANAGEMENT OBJECTIVES • Maximum Customer Service • Increased Efficiency in Operations • Minimum Investment in Inventory Effective Inventory Management Helps in Maximizing Profits While Providing Excellent Customer Service as Desired By Customers
PROVIDING CUSTOMER SERVICE • Making Products Available Exactly When Needed By Customer is Providing Customer Service in Terms of Inventory • Customer Could Be Purchaser/ Distributor/ Another Plant in the Organization/ Next Workstation Where Next Operation will Take Place • Stock Availability is a Tool to Measure Effectiveness of Inventory Management System in Organization • Inventory Helps to Maximize Customer Service By Protecting Against Uncertainty • Condition of Stock-Out Occurs If No Stock Available When Customer Requires it • Stock-Out Leads to Customer Dissatisfaction • Often Extra Inventory Held as Safety Stock to Avoid Stock-Outs
IMPROVING OPERATING EFFICIENCY • Inventories Help Manufacturing Operations To be More Productive in 4 Ways • Inventories Allow Operations with Different Rate of Production To Operate Separately and More Economically • Subsequent Operations That Have Different Production Rates & Must be Operated More Efficiently Will Build Up Inventories Between Them • Strategy of Satisfying Need for Seasonal Products with Non-uniform Demand Using Anticipatory Inventory Built Up Through Uniform Level Round the Year Production Result in Lower • Overtime Costs • Hiring/ Firing Costs • Training Costs • Sub-Contracting Costs • Capacity Requirement • Inventories Allow Longer Production Runs That Result in • Reduced Setup Costs Per Item - With Single Set Up More Quantities Produced • Increase in Production Capacity as Processing Time Greater Than Setup Times • Inventories Allow Purchase in Larger Quantities Lowering Ordering Cost Per Unit While Taking Advantage of Quantity Discounts As well
OPERATION LEVELING Quantity Jan Mar Jun Sep Dec Seasonal Demand Production
INVENTORY COSTS • Item Cost/ Landed Cost • Purchased Item=Purchase Price+Transportation Cost+Insurance+Customs Duties • Manufactured Item= Direct Material + Direct Labour + Factory Overhead • Carrying Costs/ Holding Costs: Incurred Due To Volume of Inventory Carried that Increases/ Decreases When Volumes Increase/ Decreases • Capital Costs: Depends On Interest Rate/ Credit Rating of Firm/ Other Investment Opportunities • Money Invested in Inventory & Not Available for Other Uses Thus Representing • Loss Opportunity Cost. • Minimum Cost is Loss of Interest • Storage Costs: Depends on Location & Type of Storage Needed • Costs Related to Storing Space/ Workers/ Handling Equipment • Risk Costs: Normally Low Value But 100% of Item Value for Perishable Items • Obsolescence-Loss of Product Value Due to Model/ Style/ Technology Change • Damage – Product/ Packaging Damage in Store/ Transit • Pilferage – Goods Lost/ Stolen • Deterioration – Rots/ Dissipates in Storage/ Limited Shelf Life • Carrying/ Holding Costs Expressed as Percentage of Rupee Value of Inventory per Unit of Time (Usually One Year)–Normally 20-35 % Per Year/Higher for Fashion Items
EXAMPLES A company carries average annual inventory of Rs. 2, 000,000. They estimated their costs of capital, storage and risk are 10%, 7% and 6% respectively. Calculate how much it costs annually to carry the inventory Total Cost of carrying Inventory = Cost of Capital + Storage Cost + Risk Cost = 10% + 7% + 6% = 23% Annual cost of carrying Inventory = 23/100 ×2,000,000 = Rs. 460,000.00 Given the following percentage costs of carrying inventory, calculate the annual carrying cost if the average inventory is $1 million. Capital costs are 10%, storage costs are 6% and risk costs are 7%. Total Cost of carrying Inventory = 10%+6%+7% = 23% Annual cost of carrying Inventory = 0.23×1,000,000 = $230,000.00 A florist carries an average inventory of $10, 000 in cut flowers. The flowers need special storage and are highly perishable. The florist estimates capital cost at 10%, storage cost at 25% and risk costs at 50%, What is his annual carrying cost? Total Cost of carrying Inventory = 10%+25%+50% = 85% Annual cost of carrying Inventory = 0.85×10,000 = $8,500.00
INVENTORY COSTS • Ordering Costs • Costs Associated With Placing an Order with Factory/ Supplier • Not Dependent on Quantity Mentioned in the Order • Annual Cost of Ordering Depends On Number of Orders Placed During the Year • Ordering Costs in Manufacturing Include • Production Control Costs • Annual Costs & Effort Expended in Production Control Depend on Number of • Production Orders Placed Not the Quantities Ordered in Each • Costs Related to Issuing/ Closing Orders/ Scheduling/ Machine Loading/ • Dispatching/ Expediting • Set Up & Teardown Costs • Work Centres Need to be Set Up Every Time To Run New Production Order & Tear • Down The Set Before New Order is Taken Up • Costs Not Dependent On Order Quantity But on Number of Orders Placed Per Year • Lost Capacity Costs • Every Time Order Placed with Work Centre Time Taken to Set Up is Lost Productive • Output Time • Particularly Important & Costly are Set Up Costs at Bottleneck Work Centres
INVENTORY COSTS • Ordering Costs in Purchasing • Purchase Order Cost • Costs Incurred to Place an Order Depends on Number of Orders Not Ordered Quantities • Related to Order Preparation/ Follow Up/ Expediting/ Receiving/ Authorizing Payments • Quality Inspection/ Transportation Costs • Accounting Cost of Receiving/ Paying the Invoice • Stock-Out Costs • When Demand During Lead Time of Supply Exceeds Forecast Stock- Out CostsIncreases due to • Back-Order Costs • Lost Sales • Lost Customers • Carrying Extra Inventory Protects Against Stock Outs • Capacity-Associated Costs • When Output Levels Need To be Changed Cost incurred in Overtime/ Hiring/ Training/ Running Extra Shifts / Layoffs • Costs Can be Avoided By Leveling Production & Producing at Same Rate During Slack Times for Sale During Peak Periods • Production Leveling Builds Inventory During Slack Periods
EXAMPLE • Calculate average cost of placing one order with the annual costs given below: • Production Control department salaries= Rs60,000 • Supplies & operational expenses for PC department= Rs15,000 • Cost of setting up work centres for an order= Rs120 • Orders placed each year= 2,000 Average cost of One order= Fixed Cost/ No. of orders + Variable Cost = (60000+15000)/2000 + 120= Rs157.50 Annual purchasing salaries are $65,000, operating expenses for the purchasing Department are $25,000 and inspecting & receiving costs are $25/ order. If the purchasing department places 9,000 orders a year, what is the average cost of ordering? What is the annual cost of ordering? Average cost of ordering=Fixed Cost/ No. of Orders + Variable Cost = (65000+25000)/ 9000 + 25=$35.00 Annual cost of ordering=Fixed Cost + Variable Cost × Annual No. of Orders = (65000+25000) + 9000 × 25=$315,000
EXAMPLE An importer operates a small warehouse that has the following annual costs Wages for purchasing are $45,000, purchasing expenses are $30,000, customs and brokerage costs are $25/ order, the cost of financing the inventory is 8%, Storage costs are 6% and the risk costs are 10%. The average inventory is $250,000 and 5,000 orders are placed in a year. What are the annual ordering and carrying costs? Total Cost of carrying Inventory = Cost of Capital+Storage Costs+Risk Costs = 8% + 6% + 10% = 24% Annual cost of carrying Inventory = 0.24 ×250,000 = $60,000 Average cost of One Order= Fixed Cost/ No. of Orders + Variable Cost = (45000+30000)/5000 + 25= $40 Annual cost of Ordering=Average Cost of One Order × No. of Annual Orders = 40 × 5000=$200,000
EXAMPLE A company makes and sells a seasonal product. Quarterly Sales forecasts for the product are 2,000, 3,000, 6,000, 5,000 Items for the next year. Calculate level production plan, quarterly ending inventory and average quarterly inventory. If inventory carrying costs are $3 per unit per quarter, what will be the annual cost of carrying inventory? Assume opening and closing inventories as zero. Q1 Q2 Q3 Q4 Total Sales Forecast 2000 3000 6000 5000 16000 Production Plan 4000 4000 4000 4000 16000 Ending Inventory 0 2000 3000 1000 0 Average Inventory 1000 2500 2000 500 Inventory Cost ($3/Unit) 3000 7500 6000 1500 18000.00 Average Inventory = Opening Inventory + Ending/Closing Inventory 2
EXAMPLE A company manufactures and sells a seasonal product. Based on the Quarterly sales forecasts that follows, calculate level production plan, quarterly ending Inventories and average quarterly inventories. Assume that the average quarterly inventory is the average of starting and ending inventory for the Quarter. If inventory carrying costs are $3 per unit per quarter, what will be the annual cost of carrying this anticipation inventory? Opening and ending Inventories are zero. Q1 Q2 Q3 Q4 Total 1000 2000 3000 2000 8000 Sales Forecast 2000 2000 2000 2000 8000 Production Plan 1000 1000 0 0 Ending Inventory 0 Average Inventory 500 1000 500 0 Inventory Cost ($3/ Unit) 3000 1500 $6,000 1500 0 Annual cost of carrying anticipatory Inventory = $6,000
EXAMPLE Given the following data, calculate a level production plan, quarterly ending Inventory and average quarterly inventory. If inventory carrying costs are $6 per unit per quarter, what is the annual carrying cost? Opening and ending Inventories are zero. If the company always carries 100 units of safety stock, what is the annual cost of carrying it? Q1 Q2 Q3 Q4 Total 5000 8000 8000 10000 31000 Sales Forecast 7750 7750 7750 7750 31000 Production Plan 0 0 2750 2500 2250 Ending Inventory Average Inventory 1375 2625 2375 1125 Inventory Cost 15750 14250 $45,000 8250 6750 $6 Ending Inventory 100 2850 2600 2350 100 Average Inventory 1475 2725 2475 1225 Inventory Cost $6 8850 16350 14850 7350 $47,400
SELECTIVE CONTROL OF INVENTORY • Inventory Managed By Controlling Individual Items – Stock-Keeping Units (SKU) & That Involves Costs • For Effective Inventory Control at Reasonable Cost Large Number of Items in Inventory Are Classified According To Importance of The SKU for Operations/ Business • Classifications Used To Render Selective Treatment to Different • Category of Material • Different Inventory Control Methods Used for Items Based On Different Selection Criteria • Each Classification Emphasizes On a Particular Aspect • Seasonality • Stock Turnover Rate • Consumption Rate • Value of Stocks • Annual Usage Value • Unit Price of Item • Criticality of Item • Difficulties in Procurement • Procurement Source
SELECTIVE INVENTORY MANAGEMENT Item ClassificationCriteria for Selection A-B-C (Always Better Control) Annual Usage Value H-M-L (High, Medium, Low) Unit Price of Item V-E-D (Vital, Essential, Desirable) Criticality of Item S-D-E (Scarce, Difficult, Easy) Difficulties in Procurement G-O-L-F (Government, Ordinary, Procurement Source Local, Foreign) S-OS (Seasonal, Off- Seasonal) Nature of Supplies M-N-G (Moving, Non Moving, Ghost Items) Stock Turnover Rate F-S-N (Fast, Slow, Non Moving) Consumption Rate XYZ Value of Items in Stores Categorizing Items in Stock Into Manageable Groups Facilitates Inventory Control with the Right Focus
A-B-C CLASSIFICATION - METHODOLOGY Determine Annual Usage of Each Item Multiply Annual Usage of Item by Its Cost To Get Total Annual Usage Value List Items According to Annual Usage Value in a Descending Order Calculate the Cumulative Annual Usage Value & Cumulative Percentage of Items Examine Annual Usage Distribution & Group Items into A/ B/ C Groups Based on Percentage of Annual Usage Used in Controlling Inventories of Raw Material/ Components/ WIP/ Finished Goods
10% of Items 75% of Value A - 15% of Items 15% of Value B - 75% of Items 10% of Value C - A–Frequently Monitored+ Lower Safety Stock To Avoid Stock Outs C– Least Frequently Monitored+ Highest Safety Stock A-B-C CLASSIFICATION Cumulative Value % 100 90 75 10 100 25 A B C % Items
EXAMPLE A company manufactures a line of 10 items. Their usage and unit cost are shown in the accompanying table along with annual Rupee value usage of each. Group items into ABC Classification.
SOLUTION • A-Class • 20% - Items • 78.43%-Value • B-Class • 30% -Items • 16.99%-Value • C-Class • 50% -Items • 4.58%-Value
INVENTORY CLASSIFICATION - ABC ITEMS • A-Class Items • High Priority Items Represent About (10-15)% of Items that Account • for About 70-80% of Value • Tight Control on Inventory • Keep Complete & Accurate Records • Regular + Frequent Review of Demand Forecasts • Close Follow-Up + Expediting Supplies To Reduce Lead Time • B-Class Items • Medium Priority Items Represent About (10-15)% of Items that Account • for About (10-15)% of Value • Normal Control on Inventory • Keep Good Records • Regular Attention To Demand Forecasts • Normal Processing • C-Class Items • Lowest Priority Items Represent About (70-50)% of Items that Account • for About (10-15%) of Value • Simplest Possible Control On Inventory - Stock Large Quantities • Simple Records with Periodic Review of Stocks • Order Large Quantities & Carry Safety Stocks
H-M-L ANALYSIS • H - Category of Items • High Priced Items • Tight Control on Consumption • More Frequent Verification of Stocks • Purchase Policies for Closer Control on Purchase • Higher Storage Security (Locked in Steel Cupboards) • M - Category of Items • Medium Priced Items • Medium Control on Consumption • Frequent Verification of Stocks • Medium Control on Purchase • Medium Security of Storage • L - Category of Items • Low Priced Items • Less Control on Consumption • Less Frequent Verification of Stocks • Less Stringent Control on Purchase • Standards Security Provided Used In Controlling Purchased Inventory
V-E-D ANALYSIS • V - Category of Items: Vital for Production/ Consumers • Item in C Category May Come Under Vital Category If • Non-Availability Will Cause Serious Problems/ High Stock-Out Costs • Large Lead Time for Procurement • Non-Standard Item Purchased Against Purchaser’s Design • E - Category of Items: Essential Items • High Cost of Stock-Out • D - Category of Items: Desirable Items • Nominal Cost of Stock-Out Not Affecting Business in a Big Way • Factors for Deciding VED Category of Items • Stock-Out Costs • Lead Time for Procurement • Nature of Item: Standard/ Supplier Designed/ Buyer Designed • Source of Supply: Local/ Outstation/ Imported/ Controlled Item • ABC & VED Analysis Normally Used Together for Controlling • Inventory of Spares/ Parts Criteria of Selection - Criticality of Item
S-D-E ANALYSIS • S-D-E Analysis Based on Problems Related To Procurement • Non-Availability/ Scarcity of Items • Unusually Long Lead Time • Geographical Location of Suppliers • Reliability of Suppliers • Items Classified Under 3 Groups • Scarce • Short Supply/ Long Lead Time/ Imported/ Through Govt. Agencies • Best to Limit No. of Times to Order • Difficult • Available Locally • No/ A Few Reliable Source Available • Needs Advance Notice/ Long Lad time of Procurement • Easy: Readily Available Standard Products • S-D-E Analysis Mostly Used in Purchase Department • For Deciding Purchase Methods of Different Category of Items • Allocating Responsibility By Seniority Levels of Purchasers/ Buyers Used in Lead Time Analysis & Purchase Strategy Formulation
G-O-L-F ANALYSIS • Based on Nature of Suppliers that Determine • Quality of Items • Lead Time of Supply • Terms of Payment • Continuity of Supplies • Administrative Work Involved • Classifies Items into 4 Groups By Source of Supplies • G: Government Suppliers – Public Sector Undertakings • Involves Long Lead Times • Payment in Advance/ Against Delivery • O: Ordinary (Non-Government) Suppliers • Moderate Delivery Lead Times • Credit Facility Available • L: Local Suppliers • Easy Availability • Purchased Against Cash/ Blanket Orders • F: Foreign Suppliers • Large Amount of Administrative/ Procedural Time & Costs Involved • Extensive Sourcing Necessary for Identifying the Right Supplier • Letter of Credit Method for Payment • Shipping/ Port/ Customs Clearance Needs Special Efforts/ Costs Used in Procurement Strategies
S-OS ANALYSIS • Items Grouped into 2 Groups Based on Seasonality of Product • S: Seasonal • OS: Off Seasonal • Seasonal • Seasonal Availability But Marketing Round the Year • Items Available Only During Season – Mangoes/ Oranges/ Fruits • Procured for Use in Packaged Food Industry for the Whole Year • Seasonal But Available Round the Year • Price Lowest During Harvesting Time • Procurement Based on Cost Comparison Between • Buying at Lower Price During Harvest Season & Holding Stocks for • Whole Year • Buying Throughout the Year • Seasonal Market But Available Round the Year – Winter Garments • Produced Round the Year to Meet High Seasonal Demand • Higher Inventory Carrying Cost Balanced By Lower Cost of • Producing at Uniform Level in Meeting The Seasonal Demand • Off Seasonal – Non-Seasonal Items Used in Procurement/ Holding Strategies for Seasonal Items – Agricultural Products
M-N-G ANALYSIS • Based on Stock Turnover Rate Items Classified as • M: Moving Items – Regular Consumption • N: Non-Moving Items – Not Consumed for last 1 Year • G: Ghost Items – No Stocks/ No Receipt & Issue Last Financial Year F-S-N ANALYSIS • Used in Controlling Stock Obsolescence • Last Date of Receipt/ Issue Considered To Calculate Period When • Stocks Did Not Move for Classifying Items • F: Fast Moving • S: Slow Moving • N: Non-Moving • S & N Category of Items Further Analyzed Conducting Ageing • Analysis To Decide on Appropriate Ways of Disposing Stocks X-Y-Z ANALYSIS • Used to Review Inventories & Consumption at Scheduled Intervals • Based On Value of Stocks in Stores • X Items: High Value of Inventory • Y Items: Moderate Value of Inventory • Z Items: Low Value of Inventory
INVENTORY CONTROL IN COMBINATION • X-Y-Z Analysis Used Along with ABC/ FSN Analysis Helps • To Identify Few Items Comprising Large Value Locked Up in Inventory • Indicate Actions Need to be Taken for Improving Company’s Stock Profile • X Items: High Value of Inventory • Y Items: Moderate Value of Inventory • Z Items: Low Value of Inventory Class of Items ABC XWork to Reduce Work to Convert Dispose Off Stocks To Z category To Y Category Surplus Stocks YConvert To Z category Tighten Control Z Review Stock Levels More Often Class of Items FSN XTighten Control Reduce StocksDispose Off To Low Levels at Optimum Prices YReduce Stocks Dispose Off Earliest Z Lessen ControlDispose Off Even To Reduce Admin CostsAt Lower Prices
INVENTORY CONTROL • Manage & Control Inventory To Balance • Required Level of Product Availability • Cost of Providing Desired Product Availability • Inventory Management & Control Affects • Customers • Suppliers • Major Departments in Organization Inventory Control Exercised Through Inventory Performance Measures
INVENTORY PERFORMANCE METRICS • Product Availability (Service Level) Quantity of An Item Available as Required During a Period = 100 Total Demand for The Item During That Period Higher Service Level Implies Higher SC Responsiveness • Inventory = Throughput Cycle Time Reduce Inventory By Reducing Cycle Time
FINANCIAL PERFORMANCE METRICS • Inventory Turnover Ratio/ Inventory Turns Financial Measure of How Effectively inventory is Used in Making Sales Annual Costs of Goods Sold Inventory Turns= Average Inventory in Money Value • Days of Supply Financial Measure of Equivalent Number of Days of Inventory On Hand Based on Daily Usage Rate Inventory On Hand Inventory in Days of Supply= Average Daily Usage • Higher Inventory Turns Imply Higher Efficiency in Using Inventory Asset • Financial Metrics Relates To Sales/ Revenues Generated By the Inventory • Financial Metrics Measure Inventory Management Performance Better than Just Measuring Cost of Inventory Managed
EXAMPLE A company has 9000 Units on hand and the annual usage is 48,000 units. Assuming 240 working days in a year calculate what is the inventory in terms of days of supply? If the annual cost of the goods sold is Rs 24 million a year and Value of Average inventory held is Rs 6 million what will be the inventory turns? What will be the reduction in inventory if the turns are increased to 12 times/ year? If cost of carrying inventory is 25% of average inventory, calculate the Savings • Inventory in days of supply= Average inventory on hand/ Average daily use = 9000/ (48,000÷240) = 45 Days of Sales • Inventory turns=Annual Cost of Goods Sold/ Average inventory = 24 ÷ 6 = 4 • When Inventory turns increased to 12, • Average Inventory= Annual COGS/ Turns = 24 ÷ 12 = $2 Million • Reduction in average inventory= 6,000,000 – 2,000,000 = $4 Million Carrying cost of inventory=25% Savings=25%× 4,000,000= $1,000,000
DEFINITIONS IN INVENTORY CONTROL • Stock Keeping Unit - Items Packed as Individual Units in Inventory Controlled By Quantity & Time of Procurement • Same Products with Different Colour/ Size/ No. Packed – Different SKU • Lot/ Batch – Quantity Produced/ Purchased Together Sharing Same Production/ Purchase Costs & Specifications • Lot-for-Lot Rule–Order Exactly As Needed & When Required • Ordered Quantity Changes Every Time Requirement Changes • Unused Lot-Size Inventory Not Created as SKU Ordered When Needed • Applicable for High Value Items & JIT Applications • Fixed-Order Quantity Rule – Arbitrarily Specifies No. of Units/ SKU To Order Each Time Order is Placed • Based On Usage Rate/Lead Time/Future Demand For Given Time Period • Does Not Minimize Costs Involved • Min-Max System – A Variation of Fixed Order Rule • When Quantity On Hand Reaches Reorder Level New Order Placed for Quantity = Max Level – Quantity On Hand
INVENTORY COSTS • Ordering/ Set Up Costs • Transportation/ Receiving/ Inspection • Carrying/ Holding Costs • Space • Capital • Inventory Servicing • Inventory Risk • Stock-Out Costs • Inventory Costs are in Trade-Off With Each Other Total Annual Inventory Costs (TAIC) = Annual (Material Cost + Ordering Cost + Carrying Costs)
CARRYING COST ELEMENTS • Interest & Opportunity Costs ……. 82% • Obsolescence & Physical Depreciation Costs .. 14% • Storage & Handling Costs ……. 3.25% • Taxes …….. 0.50% • Insurance ……… 0.25% Annual Carrying Costs 20% to 35% of Value of Inventory
ANNUAL TOTAL COST • Cost of Ordering & Carrying Inventory Depend on No. of Orders • Placed in a Year & Quantity Ordered Each Time • Relevant Costs for Inventory Control • Annual Costs for Placing Order: Ordering Cost • Annual Costs of Carrying Inventory: Annual Carrying Cost as % of Annual Average Inventory S = Annual Demand in Units Cu = Unit Price (Rs) q = Order Quantity in Units Cp = Ordering Cost/ Order (Rs) i = Inventory Carrying Cost as Percentage of Average Inventory Investment • Annual Ordering Cost = No. of Orders/Year × Ordering Cost = S/q × Cp • Annual Carrying Cost = Average Inventory × Inventory Carrying Cost = ½ × Order Quantity × Carrying Cost(%) × Unit Price = q/2 × i × Cu • Annual Total Cost = Annual Ordering Cost + Annual Carrying Cost ATC = (S/q × Cp) + (q/2 × i × Cu)
2.S.Cp i.Cu S × Cp q² i × Cu 2 d(ATC) dq Or q² = = Or 2.S.Cp i.Cu Or q = 2 × Annual Demand × Ordering Cost/ Order Inventory Carrying Cost × Unit Price EOQ FORMULA DEVELOPMENT • Optimizing of Inventory Model Involves Calculating Order Quantity ‘q’ That Minimizes Annual Total Cost (ATC) • Differentiating ATC with Respect to ‘q’ & Setting First Derivative to Zero will Minimize Annual Total Cost ATC= (S/q × Cp) + (q/2 × i × Cu) S × Cp q² i × Cu 2 Or = – = 0 + EOQ =
ECONOMIC ORDER QUANTITY Total Cost/Unit Time Cost Inventory Carrying Cost Ordering/ Set up Cost EOQ Quantity • Ordering Cost vis-à-vis Carrying Cost Trade-off • Total Annual Cost Gets Optimized When Ordering Cost=Carrying Cost • Economic Order Quantity Ensures Optimal Annual Total Cost of Inventory 2 × Annual Demand × Ordering Cost/ Order EOQ = InventoryCarrying Cost × Unit Price
2 × Annual Demand × Ordering Cost/ Order Inventory Carrying Cost × Unit Price EOQ = EXAMPLE A company uses 75 number of an item per month. Each unit costs the company Rs 25/-. Cost of placing each order & inventory carrying charges per month are computed at Rs 36/- and 1.5% of the average inventory investment respectively. Calculate the economic lot size for purchase of the item to minimize total cost. Annual Demand = 75 × 12 = 900 Units Ordering Cost/ Order = Rs 36 Inventory Carrying Cost/ Year = 1.5/100 × 12 = 0.18 2 × 900 × 36 0.18 × 25 EOQ = = 120 Units
ASSUMPTIONS IN EOQ MODEL • Annual Demand is Known & Remains Constant • Known Delivery Time that Does Not Change • Replenishment of Stock is Instantaneous • Unit Price Fixed & No Quantity/ Price Discounts Allowed • Inventory Carrying Cost Known and Remains Constant • Ordering Cost is Known and Remains Constant • No Stock-Outs Allowed • Items Can be Procured Free From Any Restriction One Variation of Classical EOQ Model is Quantity Discount/ Price-Break Model
QUANTITY DISCOUNT/ PRICE-BREAK MODEL • Constant Unit Price Condition Relaxed & Purchase Quantity • Discounts Allowed • Purchase Cost & Total Annual Inventory Cost are Important • Criteria For Determining Optimal Order Size • Lowest TAIC (Total Annual Inventory Costs) • = Annual Material Costs + Annual Ordering Costs + • Annual Carrying Costs • Procedure to Arrive at Best Order Quantity • For Each Purchase Price Calculate EOQ • If EOQ Too Low To Qualify for Price Discounts Increase Quantity to • Match Lowest Qualifying Order Quantity • Calculate TAIC for Each Price & Corresponding Quantity • Select Price/ Quantity Combination that Results in Lowest TAIC • (Total Annual Inventory Costs)
2 × Annual Demand × Ordering Cost EOQ = ----------------------------------------------- Carrying Cost × Unit Price QUANTITY DISCOUNT/ PRICE-BREAK MODEL Soccer Ball Example Supplier’s Offer: Order Qty. of Soccer Balls Price ($) Below 1, 000 5.00 Between (1, 001 – 2, 000) 4.50 Above 2, 000 4.00 Customer Data: Ordering Cost = $40 Annual Demand = 15, 000 Carrying Cost = 25% • EOQ with $5 price = [2×15000×40] ÷ [0.25 × 5] = 980 Balls • EOQ with $4.5 price = [2×15000×40] ÷ [0.25 × 4.5] = 1, 032 Balls • EOQ with $4..0 price = [2×15000×40] ÷ [0.25 × 4)] = 1, 095 Balls Right Quantity & Price to Achieve Best Savings is the Combination That Results in Lowest Total Annual Inventory Cost (TAIC)