Download

1 / 59
590 likes | 629 Vues
Create a portable device using Raman spectroscopy to distinguish cancerous skin cells non-invasively & quickly. Improve user experience & market value. Ensure safety & reliability.

E N D
In Vivo Raman Spectroscopy of Cancerous Skin Cells Stephen Esposito (CpE) Michael Gonzalez (EE) Chelsea Greene (EE) Megan Melvin (PSE) Group 8 CREOL
Live Action Safe Examination Raman Spectrometer - L.A.S.E.R.S. Advising from Dr. Kyu Young Han & Dr. Peter J. DelfyettSponsored by Ocean Optics
Motivation Cancer is the 2nd leading cause of death in the U.S. Skin cancer is the most common type of cancer Skin biopsies: Invasive, painful, costly Results may take several days Pathologist visually inspects biopsy
General Specifications Construct a handheld probe weighing less than 3 lbs (1.4 kg) for comfort and ease of use. Capture an image of the sample area at least as large as the beam spot size. Analyse the Raman spectra and discriminate the intensity and wavenumber differences between normal and scarred (or cancerous) skin. Display results in an easy-to-interpret manner.
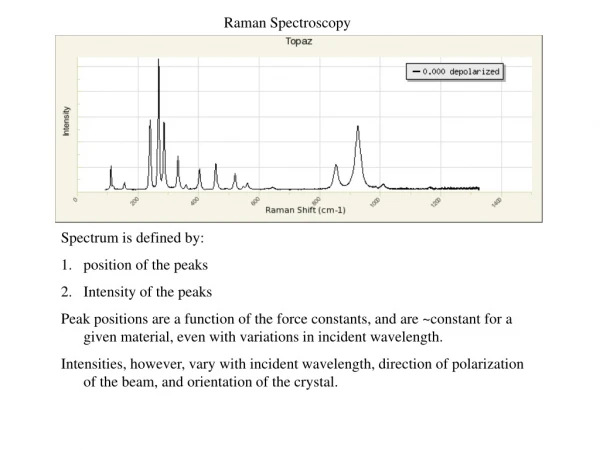
Goals and Objectives Use Raman spectroscopy to identify cancerous skin cells Differences in the Raman shift of normal cells versus that of cancerous cells Benefits of Raman: • Non-invasive • Non-destructive • Fast results Average normalized spectra of normal skin, basal cell carcinoma, and melanoma, showing differences in relative intensities and peak wavelengths. [DOI: 10.1117/1.JBO.17.7.077003]
Optical Specifications Achieve a narrow laser bandwidth of less than 4.7 nm (65 cm-1) enabling the nearest Raman signal to be acquired (851 nm or 1000 cm-1). Deliver at least 20 mW of laser power to the sample. Restrict the temperature increase of the sample to less than 10 degrees Celsius (non-painful). Collect the Raman signal over a minimum range of 1000 to 1800 cm-1 (851 to 914 nm).
Computer and Electrical Specifications Power to component +/- 5% of ideal rated value No more than 15 V within the device Minimum 5 megapixel camera System temperature below 142℉/60.6℃ Cannot permanentlyattach donated parts Data sampling and compiling time must be under 5 minutes Exposure time to sample less than 30 seconds User interface can run on various on market devices Modular design to ease troubleshooting
Requirements Follow all necessary standards Reliable, effective, ergonomic Logical with time and economic constraints Safe, no risk to patient or user Fit in typical office environment Cost effective for user
Sponsor Requirements Improve an on-market device Add value to a product, increase marketability Improve the user experience Specific for target market Improve visibility of sample scanned with camera and light
Data and Power Flow
Safety Personal Protective Equipment (PPE): Laser safety glasses Engineering controls: Protective housing Laser activation warning Output power controlled Administrative & Procedural controls: Proper labelling Product user manual
Encasing Design and Structure Side View Top View
Additional Electronics Elements Power to laser indicator LED Safety switch Screen (in probe) Camera (in probe) LED beam (in probe)
Laser 1 m Fiber High-Power > 350 mW Spectrum-Stabilized Near-infrared 785 nm excitation wavelength Class IIIb (Class I if enclosed) Delivers laser light to probe via optical fiber 6.4 cm 7.6 cm
Spectrometer 8.91 cm Ocean Optics USB2000+ High resolution, high SNR Raman signal from probe is delivered to spectrometer via optical fiber 6.33 cm 1 m Fiber
Raspberry Pi 3 85 mm Important Specifications: 1.2GHz quad-core ARMv8 Processor 1GB Ram 40 GPIO Pins 4 USB Ports HDMI Port 56 mm
Heat Concerns: Main Body System Instability- Laser and Microcontroller User safety Addressed with: • Temperature Sensor (Dallas DS18B20) • Heat Sinks • Fan
Camera 25 mm Allows for imaging and visibility of sample High resolution, small, effective with changes in light Allow real-time video feedback of skin sample Allow for photographing the tested skin sample Easy to interface with microcontroller White LED illuminates skin/sample 24 mm 16 mm
Optics 19.05 mm 12.7 mm Optical fibers for NIR transmission AR coated plano-CX lenses for collimation and focusing Beamsplitter to decrease incident power, redirect Raman signal Mirror Longpass filter to diminish Rayleigh signal (785 nm), allow transmission of Raman signal ( > 800 nm) Longpass Filter Mirror 6.35 mm 25.4 mm (1“) Lens Beamsplitter
Mounting the Optics Within the Probe Optics within the probe must be well-aligned and sturdy. 3D printed mounts allow for custom-sized optical holders. Can print individual holders and/or as a channel for the rays to travel through. Use optical glue and/or set screws.
System Control Control Program Java-based backend Omni Driver Java API - Spectrometer Control Pi4J Library - GPIO Pin Control Control Ports Spectrometer - USB Port Laser- GPIO Pin Temperature Sensor- GPIO Pin Camera System- CS Interface Fan System- GPIO Pins
OmniDriver Ocean Optic’s Driver for all USB spectrometers Cross Platform- Java, C#, Visual Basic, etc. Allows us to create own intuitive backend program to control spectrometer Due to the cross-platform nature, this program should be able to be controlled via the 15 billion java devices
Pi4J Open Source Project Low Level I/O Library Object-Oriented API Event Based GPIO Pin control
Data Analysis • Laser Spectrum Analysis ( 100 Pass Average) • Dark Spectrum Analysis (100 Pass Average) • Laser Spectrum - Dark Spectrum • Remove Nonlinearity • Apply Smoothing • Return Results Laser Spectrum Analysis- Use Laser/Spectrometer System to Analyze Skin Sample Run 100 Times to reduce impact of outlier results ~30s Runtime Dark Spectrum Analysis- Use Spectrometer to analyze raman signal without laser input Run 20 Times to reduce impact of outlier results ~5s Runtime Ensemble Average Smoothing- Run over all 100 data passes Reduces SNR by factor of 10-fold on 100 pases
User Interface Visual representation of the project to end-users Specifications: Intuitive Professional Minimalistic
Budget Goal Cost effective: < $1,500.00 Sponsorship from Ocean Optics Donations from CREOL Current cost total: $341.12