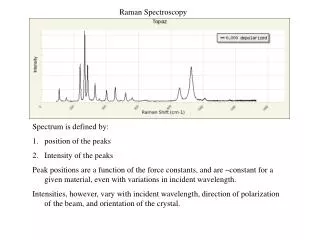
Raman Spectroscopy
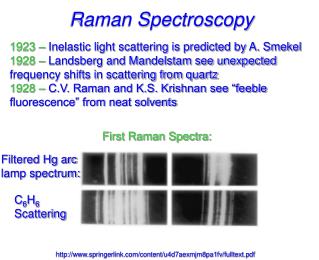
Raman Spectroscopy. 1923 – Inelastic light scattering is predicted by A. Smekel 1928 – Landsberg and Mandelstam see unexpected frequency shifts in scattering from quartz 1928 – C.V. Raman and K.S. Krishnan see “feeble fluorescence” from neat solvents . First Raman Spectra:. Filtered Hg arc

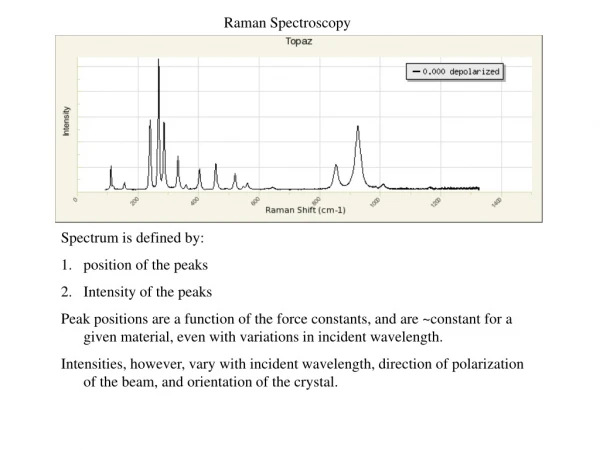
Raman Spectroscopy
E N D
Presentation Transcript
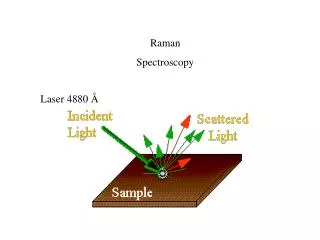
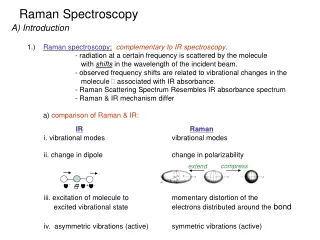
Raman Spectroscopy 1923 – Inelastic light scattering is predicted by A. Smekel 1928 – Landsberg and Mandelstam see unexpected frequency shifts in scattering from quartz 1928 – C.V. Raman and K.S. Krishnan see “feeble fluorescence” from neat solvents First Raman Spectra: Filtered Hg arc lamp spectrum: C6H6 Scattering http://www.springerlink.com/content/u4d7aexmjm8pa1fv/fulltext.pdf
Raman Spectroscopy 1923 – Inelastic light scattering is predicted by A. Smekel 1928 – Landsberg and Mandelstam see unexpected frequency shifts in scattering from quartz 1928 – C.V. Raman and K.S. Krishnan see “feeble fluorescence” from neat solvents 1930 – C.V. Raman wins Nobel Prize in Physics 1961 – Invention of laser makes Raman experiments reasonable 1977 – Surface-enhanced Raman scattering (SERS) is discovered 1997 – Single molecule SERS is possible
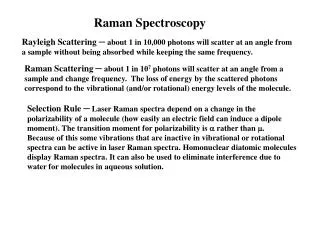
Rayleigh Scattering • Elastic ( does not change) • Random direction of emission • Little energy loss Eugene Hecht, Optics, Addison-Wesley, Reading, MA, 1998.
virtual state Scattered Excitation v” = 1 v” = 0 Infrared (absorption) Raman (scattering) Raman Spectroscopy 1 in 107 photons is scattered inelastically Rotational Raman Vibrational Raman Electronic Raman
Classical Theory of Raman Effect mind = aE polarizability Colthup et al., Introduction to Infrared and Raman Spectroscopy, 3rd ed., Academic Press, Boston: 1990
Photon-Molecule Interactions When light interacts with a vibrating diatomic molecule, the induced dipole moment has 3 components: Rayleigh scatter Anti-Stokes Raman scatter Stokes Raman scatter Kellner et al., Analytical Chemistry
Must also have a change in polarizability Raman Scattering Selection rule: Dv = ±1 Overtones: Dv = ±2, ±3, … Classical Description does not suggest any difference between Stokes and Anti-Stokes intensities www.andor.com
Are you getting the concept? Calculate the ratio of Anti-Stokes to Stokes scattering intensity when T = 300 K and the vibrational frequency is 1440 cm-1. h = 6.63 x 10⁻³⁴ Js k = 1.38 x 10⁻²³ J/K
Presentation of Raman Spectra lex = 1064 nm = 9399 cm-1 Breathing mode: 9399 – 992 = 8407 cm-1 Stretching mode: 9399 – 3063 = 6336 cm-1
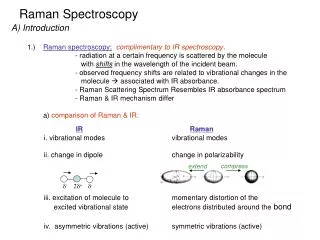
Mutual Exclusion Principle • For molecules with a center of symmetry, no IR active transitions are Raman active and vice versa • Symmetric molecules IR-active vibrations are not Raman-active. Raman-active vibrations are not IR-active. O = C = O O = C = O Raman active Raman inactive IR inactive IR active
Raman vs IR Spectra Ingle and Crouch, Spectrochemical Analysis
Raman vs Infrared Spectra McCreery, R. L., Raman Spectroscopy for Chemical Analysis, 3rd ed., Wiley, New York: 2000
Raman vs Infrared Spectra McCreery, R. L., Raman Spectroscopy for Chemical Analysis, 3rd ed., Wiley, New York: 2000
Raman Intensities Radiant power of Raman scattering: s(nex) – Raman scattering cross-section (cm2) nex – excitation frequency E0 – incident beam irradiance ni – number density in state i exponential – Boltzmann factor for state i s(nex) - target area presented by a molecule for scattering
Raman Scattering Cross-Section s(nex) - target area presented by a molecule for scattering Table adapted from Aroca, Surface Enhanced Vibrational Spectroscopy, 2006
Raman Scattering Cross-Section CHCl3: C-Cl stretch at 666 cm-1 Table adapted from Aroca, Surface Enhanced Vibrational Spectroscopy, 2006
Advantages of Raman over IR • Water can be used as solvent. • Very suitable for biological samples in native state (because water can be used as solvent). • Although Raman spectra result from molecular vibrations at IR frequencies, spectrum is obtained using visible light or NIR radiation. • =>Glass and quartz lenses, cells, and optical fibers can be used. Standard detectors can be used. • Few intense overtones and combination bands => few spectral overlaps. • Totally symmetric vibrations are observable. • Raman intensities a to concentration and laser power.
Advantages of IR over Raman • Simpler and cheaper instrumentation. • Less instrument dependent than Raman spectra because IR spectra are based on measurement of intensity ratio. • Lower detection limit than (normal) Raman. • Background fluorescence can overwhelm Raman. • More suitable for vibrations of bonds with very low polarizability (e.g. C–F).
Raman and Fraud Lewis, I. R.; Edwards, H. G. M., Handbook of Raman Spectroscopy: From the Research Laboratory to the Process Line, Marcel Dekker, New York: 2001.0
Ivory or Plastic? Lewis, I. R.; Edwards, H. G. M., Handbook of Raman Spectroscopy: From the Research Laboratory to the Process Line, Marcel Dekker, New York: 2001.
The Vinland Map: Genuine or Forged? Brown, K. L.; Clark, J. H. R., Anal. Chem. 2002, 74,3658.
The Vinland Map: Forged! Brown, K. L.; Clark, J. H. R., Anal. Chem. 2002, 74,3658.
Resonance Raman Raman signal intensities can be enhanced by resonance by factor of up to 105 => Detection limits 10-6 to 10-8 M. Typically requires tunable laser as light source. Kellner et al., Analytical Chemistry
Resonance Raman Spectra Ingle and Crouch, Spectrochemical Analysis
Resonance Raman Spectra lex = 441.6 nm lex = 514.5 nm http://www.photobiology.com/v1/udaltsov/udaltsov.htm
Raman Instrumentation Tunable Laser System Versatile Detection System
Dispersive and FT-Raman Spectrometry McCreery, R. L., Raman Spectroscopy for Chemical Analysis, 3rd ed., Wiley, New York: 2000
Spectra from Background Subtraction McCreery, R. L., Raman Spectroscopy for Chemical Analysis, 3rd ed., Wiley, New York: 2000
Rotating Raman Cells Rubinson, K. A., Rubinson, J. F., Contemporary Instrumental Analysis, Prentice Hall, New Jersey: 2000
Raman Spectroscopy: PMT vs CCD McCreery, R. L., Raman Spectroscopy for Chemical Analysis, 3rd ed., Wiley, New York: 2000
Fluorescence Background in Raman Scattering McCreery, R. L., Raman Spectroscopy for Chemical Analysis, 3rd ed., Wiley, New York: 2000
Confocal Microscopy Optics McCreery, R. L., Raman Spectroscopy for Chemical Analysis, 3rd ed., Wiley, New York: 2000
Confocal Aperture and Field Depth McCreery, R. L., Raman Spectroscopy for Chemical Analysis, 3rd ed., Wiley, New York: 2000 and http://www.olympusfluoview.com/theory/confocalintro.html
Confocal Aperture and Field Depth McCreery, R. L., Raman Spectroscopy for Chemical Analysis, 3rd ed., Wiley, New York: 2000