Download
1 / 12
130 likes | 304 Vues
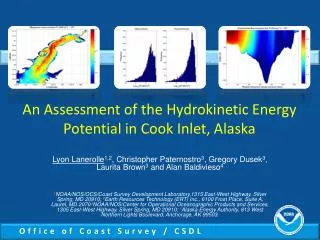
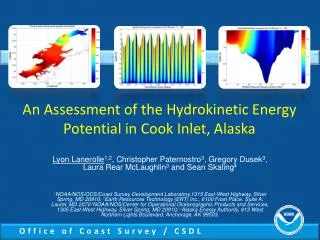
An Assessment of the Hydrokinetic Energy Potential in Cook Inlet, Alaska. Lyon Lanerolle 1,2 , Christopher Paternostro 3 , Gregory Dusek 3 , Laura Rear McLaughlin 3 and Sean Skaling 4

E N D
An Assessment of the Hydrokinetic Energy Potential in Cook Inlet, Alaska Lyon Lanerolle1,2, Christopher Paternostro3, Gregory Dusek3, Laura Rear McLaughlin3and Sean Skaling4 1NOAA/NOS/OCS/Coast Survey Development Laboratory,1315 East-West Highway, Silver Spring, MD 20910; 2Earth Resources Technology (ERT) Inc., 6100 Frost Place, Suite A, Laurel, MD 2070; 3NOAA/NOS/Center for Operational Oceanographic Products and Services, 1305 East-West Highway, Silver Spring, MD 20910; 4Alaska Energy Authority, 813 West Northern Lights Boulevard, Anchorage, AK 99503.
Introduction and Motivation • Alaska Energy Authority (AEA) is interested in optimal locations for siting hydrokinetic energy projects in Cook Inlet, AK • AEA-NOAA/National Ocean Service (NOS) partnership was established • NOAA/NOS/CO-OPS performed field study in Summer 2012 with current meters • NOAA/NOS/Office of Coast Survey (OCS)/CSDL performing numerical ocean model simulations to complement field study • Numerical model output fields are seamless spatio-temporally (no gaps) and gridded – hence, well suited for producing maps, etc. • Final assessment from modeling study will provide AEA with guidance on turbine placement, etc.
Field Study Areas and Modeling Domains • Field study had 10 current meters (magenta circles) • Model has a parent domain (blue) • Also 2 high resolution nests to better resolve physics • Kachemak Bay nest (red) • Upper Cook Inlet nest (green) • Model nesting technology previously established at NOAA/NOS/OCS/CDSL
Numerical Model Set-up • Use Rutgers University’s Regional Ocean Modeling System (ROMS) for model simulations • ROMS run for 36 days beginning 01/01/2008 • Model forced with tides only (no sub-tidal, river or meteorological forcings included) - ~90% of water level/current signal is purely tidal • Tidal boundary forcing from ADCIRC model tidal harmonic constituent database • Tides ramped over 5-days linearly in time • Used final 30-days of simulation for analysis
Model Grid Spatial Resolution (m) Parent Grid Kachemak Bay Nest Upper Cook Inlet Nest Δξ Δη
Digital Elevation Map (DEM) • Need DEM to account for heavy tidal flooding-drying • DEM created with best available bathymetry, shoreline, topography data at NOAA/NOS/OCS/CSDL • Bathymetry – NOAA/NOS soundings • Shoreline - NOAA/NGDC, NGS • Topography – USGS gridded product • DEM clipped at 15m height (not a Tsunami model)
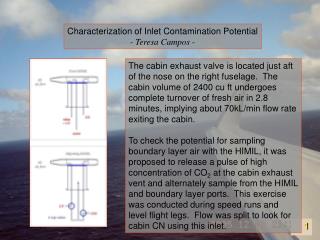
Maximum Power Density on Parent Grid Near surface Mid-water Near-bottom • Power Density, P=0.5*ρ*|U|3 where |U|=(u2 + v2)1/2 as w << u, v; [P] = W/m2 • Plot P in a Log10 scale for clarity and contrast • Highest P near surface and lowest near bottom but with similar distributions • Geographically, highest P : along axis of Cook Inlet, North Foreland, strait between West Foreland and East Foreland (and some isolated locations in upper CI) • Maximum P ~ 30 kW/m2
Maximum Power Density on Nested Grids Kachemak Bay Upper Cook Inlet • Although some differences seen, Parent and Nested grids reflect similar Power Densities • Little power available within Kachemak Bay • Upper Cook Inlet is energetic • High PD values in Upper Cook Inlet due to flooding-drying in narrow channels Parent Parent Nest Nest
Vertical Distribution of Power Density Parent Nest Parent Nest • Transects are time snapshots • Transects show the parent and nested domains give similar results • Kachemak Bay less energetic and has weak PD stratification • Upper Cook Inlet more energetic and PD is stratified with higher values in the near-surface region
Spatio-Temporal Power Density Evolution Kachemak Bay Upper CI • Hovmoller diagrams for the parent (left) and nested (right) domains are similar • Weak vertical stratification and action of bottom stress apparent • Highest power at flood tide and lowest power at slack tide
Power Extraction Times Parent Parent Parent Grid Nest Nest • PE time = available time (hrs.) to extract at least 1 kW/m2 over the 30-day simulation period • Can set the threshold (in this case 1 kW/m2 ) to value we choose • PE times reflect maximum near-surface Power Density distributions • PE times between parent and nested domains similar but also some differences • Highest PE timesin strait between E and W Foreland and in North Foreland • Other “hot spots” : Anchor Pt. (300-400 hrs., ~50% of the time), Pt. Possession (400-450 hrs), • Fire Island (400-450hrs., ~60% of the time), channels in Knik Arm (400-450 hrs)
Conclusions and Future Work • The ROMS model was used to provide a numerical assessment of hydrokinetic power in Cook Inlet, Alaska • This initial assessment used only tidal forcing (~90% of current signal) • This study showed that the optimal locations for turbine placement are: • Anchor Point vicinity • the strait between West and East Foreland (near Nikiski) • North Foreland region • Point Possession vicinity • Northern Fire Island region • along the channels in Knik Arm • Typically 300-450 hrs. of power at a threshold of 1 kW/m2is available over 30-days which is ~50%-60% of the time • KachemakBay has little power availability unlike upper Cook Inlet • In the vertical, most power is in upper half of water column • Results between parent domain and higher resolution nests are similar • Future work: run fully synoptic hindcast simulation for summer of 2012 with also sub-tidal, river and meteorological forcing and repeat analysis and compare outcome with present analysis