Download
1 / 40
400 likes | 419 Vues
Learn about the new measurement program tracking freshwater exchange in Davis Strait and its impact on Arctic freshwater budget, ocean circulation, and ice formation. Discover current observations and challenges faced in monitoring this critical component of the Arctic system.

E N D
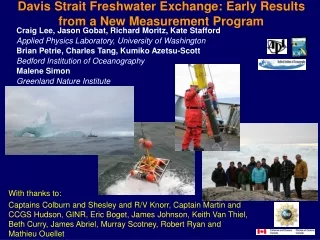
Davis Strait Freshwater Exchange: Early Results from a New Measurement Program Craig Lee, Jason Gobat, Richard Moritz, Kate Stafford Applied Physics Laboratory, University of Washington Brian Petrie, Charles Tang, Kumiko Azetsu-Scott Bedford Institution of Oceanography Malene Simon Greenland Nature Institute With thanks to: Captains Colburn and Shesley and R/V Knorr, Captain Martin and CCGS Hudson, GINR, Eric Boget, James Johnson, Keith Van Thiel, Beth Curry, James Abriel, Murray Scotney, Robert Ryan and Mathieu Ouellet
Recent update of classic • Aagaard and Carmack Arctic • Freshwater Budget • Ocean plays a critical role in Arctic FW budget. • Arctic outflow: CAA, Fram Strait, Barents Sea. Impacts MOC, FW source for lower latitude basins. • FW inflow: Bering Strait, rivers, P-E. • Atlantic inflow (‘negative FW inflow’): Fram Strait, Barents Sea. Impacts ice formation and melting. • Uncertainties still high in most of the ocean components. Serreze et al., 2006
Freshwater fluxes • through the major • ocean gateways • Davis Strait integrates the CAA outflow with all transformations prior to entering the N. Atlantic. • Relative impact of West Greenland Current, Baffin Island Current on Labrador Sea stratification. • CAA/Davis Strait + Fram Strait captures nearly all of the Arctic FW discharge. from Dickson et al, 2005
S • Motivation and Focus • CAA throughflow, integrated influence of terrestrial inputs and oceanic processes. • Waters exiting Davis Strait directly influence Labrador Sea deep convection sites. • Partitioning between FW exchange west and east of Greenland, impacts on deep water formation and meridional overturning circulation. • Challenges • Small internal deformation scale- dynamically wide strait. • Broad West Greenland shelf. • Ice cover & icebergs. • Freshwater moves in thin (~50 m) surface layer.
Observations: Annual mean currents in 4 depth intervals • Main features: • Strongly cyclonic circulation in Baffin Bay at all levels • Inflow from Smith and Lancaster Sounds, Davis Strait • Outflow to Labrador Sea across Davis Strait for most of its deep area • Intensification of cyclonic circulation in >614 m panel at some sites
Observed Seasonal Circulation in upper 200 m • Main features: • Weakest circulation over most of domain in winter • Northward flow in western Davis Strait in winter • Intensification of West Greenland Current inflow in fall • Strong horizontal shear, central, eastern Baffin Bay • Evidence of Baffin Island Current in all seasons
Modeled 50m Currents late summer-early fall • Model captures: • Cyclonic nature of circulation in Baffin Bay • Bifurcation of the WGC into northward-flowing and Labrador Sea branches at Davis Strait • Strong Baffin Island Current augmented by inflows from Arctic archipelago • Counter-current in eastern Baffin Bay between 72N and Davis Strait
Davis Strait: modeled and observed flows • Fall Circulation at 150, 300 & 500 m • Complex flow field as the WGC splits and the BIC encounters diverging isobaths • Reasonable agreement at all depth levels • Inflow only at the easternmost mooring • Flow reversal within 30 km of this mooring • At deepest level, this appears due to the counter-current that developed around 72N in Baffin Bay
Fall Transport through Davis Strait Fall current structure across Strait from model with the WGC evident over the slope and shelf break. Depth integrated flows from model (line) and observations (bars); Transport integrated across the Strait from the model and the observations
Annual and Interannual variability of the southward currents/transport (a) Site A, 150m; pronounced annual cycle with Site A northward flow in late fall and winter; (b) Site D, 150m; strongest overall southward current; (c) Site E, 150 m; WGC with strong annual cycle; (d) Net (solid circle), southward (open circle), northward (open triangle) and E (solid triangle) transport through Davis Strait. Interannual variability is evident. Site D Site E E & Northward Net & Southward
Davis Strait Freshwater Transport • CAA throughflow, integrating modifications by terrestrial inputs and oceanic processes during southward transit. • Waters exiting Davis Strait directly influence Labrador Sea deep convection sites. • Well-positioned for investigating how the Arctic freshwater system modulates deep water formation and influences the associated meridional overturning circulation. Volume Transport • Blue and red lines from moored array, no data in upper 150 m. • Green squares from hydrographic surveys. • Upper ocean critical to resolving southward freshwater flux. • Significant seasonal and interannual variability. • Ice and shelf components missing. • Difficult to monitor due to seasonal ice cover. Freshwater Transport Monthly Mean Wind Speed NAO index J. Cuny, UW
Davis Strait Measurement Suite: 2004 – 2007 • Subsurface moorings (ADCP, C-T, ULS, RCM-8) • Bottom landers (ADCP, C-T, ICECAT) • 780 Hz acoustic sources • Long-endurance gliders • Ship-based hydrography- oxygen isotopes, nutrients, trace metals, CFCs • Acoustic marine mammal tracking (Stafford & Moore)
Sep 2004 Sep 2005 q q S S
Seasonal Long-term Temperature Salinity Properties Long-term distributions built from CTD, bottle and moored T/S recorder data (winter & spring). Water masses designated after Tang et al. 2004. Arctic , West Greenland and Baffin Bay Deep Water masses. The missing BBDW & AW reflect the inadequacies of sampling in spring and winter.
September 2004 CTD Sections Main features: classic water mass structure on NL; warmer/saltier WGW; territorial dominance of WGW on SL with weakly sloping density surfaces and consequently weak transport.
September 2005 CTD Sections Main features: classic water mass structure on NL; structure similar to 2004 with less dominance (percentage of section area) by WGW on all lines; weakly sloping density surfaces and consequently weak transport on SL.
October 2006 CTD Sections Main features: on ML, WGC confined more tightly to the slope in 2006 compared to 04 and 05; large cross-sectional area of CIL (T<0) off Baffin Island and at other sections downstream;
Mooring Line T-S: 2004 (black), 2005 (blue), 1928-2004 climatology (red) • Greater variability in 2005 T-S (more intermediate water masses). • 2005 cooler than 2004 (shallow, west). • Both years warmer & more saline than climatology.
2004 Hydrographic Anomalies 2005 2004 2005
Autumn 2004 and 2005 Geostrophic currents Transport (106 m3/s) FW (103 m3/s) Section N S Net FW N S Net FW NL 1.0 3.8 -2.8 -133 1.5 4.0 -2.5 -130 ML 0.8 3.7 -2.9 -102 0.2 3.3 -3.1 -113 SML 0.3 3.0 -2.7 -116 0.8 2.8 -1.9 -107 SL 1.4 2.1 -0.8 -63 1.7 1.5 0.2 -47
Nutrient Distributions 2004 2005
Trace Metals Motivation - contribute to baseline dataset for region, water mass tracing (Arctic vs. Atlantic contributions), quantify fluxes from Arctic to Labrador Sea and from WGC to Baffin Bay.
Davis Strait Array: 05/06 Data Return • Recovered 2004/2005 BI4 lander with 1-year ADCP, 2-year CT records. • C1 ULS returned data, others failed. • C4 ADCP failed (multiple resets, file corruption). Perhaps faulty y-cable? • All 2005/2006 sites except C6 recovered. • ICECATs at 20 m- Year-long record at WG2, truncated in April at BI2.
Moored Array: 48h low-pass velocity • Strong tidal currents, spring-neap cycle. • Short inner West Greenland shelf record (WG3) reveals weak flow (2-3 cm/s). • Currents at West Greenland shelf edge (WG1) reach 10-15 cm/s.
Mooring Temperature and Salinity • Seasonal cycle in T over Greenland slope, subtle over Baffin slope. • Fresh pulse along Baffin shelf/slope Nov-Feb. • C3 consistently cold, fresh. • C4 periodically influenced by warmer, saline Atlantic waters. • C5, C6 see north-flowing Atlantic and West Greenland current.
Baffin Shelf Moorings Greenland Shelf Moorings ICECAT Measurements near ice-ocean interface.
Rough initial transport estimates. • Large error bounds- formal estimates will employ an OA. • Reliance on WG1 biases WG shelf high. • Baffin shelf relies on C6. • Array does not resolve velocity covariance scales.
Seaglider and Sensors • Hull length: 1.8 m, Wing span: 1.0 m • Mass: 52 kg • Easy to deploy and recover • Surface to 1000 m. • Horizontal speed 0.1 - 0.45 m/s (~22 km or 12 nm per day @0.25 m/s) • Vertical speed 0.06 m/s (minimum) • Buoyancy range ~840 g • 5 kg/m3 density range ►250 g • Endurance depends on ambient stratification, dive depth and desired speed • Longest range to date: 3900 km • Longest endurance to date: 31 weeks • Sensors • SBE Conductivity/Temperature • SBE 43 Dissolved Oxygen • Inferred • Depth-Averaged Current • Surface Current • Vertical Current Profile (|w|>0.5 cm/s)
Handling • Hull length: 1.8 m • Wing span: 1.0 m • Mass: 52 kg • Easy to deploy and recover- RHIBs, fishing boats, research vessels, aircraft (?). • Hand-launch and recover from small boats • Crane launch from larger vessels • Pole-and-lasso or recovery from large vessels • Use small boats from larger vessels when possible
Under-Ice Glider Acoustic Navigation • North Pacific test (260 Hz). Sep ‘04 – Mar ‘05 • Lofoten Basin test (780 Hz). Jul – Aug ‘05. • Davis Strait moored receivers. (04/05, 05/06) • 780 Hz • 0 – 200 km range, 2 depths • One-year record, variations in ice cover and stratification • Davis Strait glider. Sep – Nov(?) ’05. • Full test of system. • Data needed to develop navigation algorithms and autonomy. • North Pole Observatory. ’06 • Test altimeter and ice detection. • Davis Strait, 2-3 gliders. Oct ’06.
Excellent correlations to maximum range (currently ~150 km). • Real-time navigation, but not depth average current. • Fix accuracy may improve with post-processing. • Late Oct, early Nov test of ice attenuation. • Retreat from ice edge, recover before Strait fully ice-covered.
Arctic Navigation and Telemetry • High-latitude Navigation and Telemetry Workshop- Winter 2006. Funded by NSF Office of Polar Programs • Objectives: • Technical focus- produce specification for acoustic navigation and telemetry system for immediate use by developers. • Identify additional research needs and promote activity. • Long-term coordination and collaboration. • Steering committee: Gascard (LODYC), Farbach (AWI), Frietag (WHOI), Mikhalevsky (SAIC), Howe, Gobat, Lee (UW-APL) • Long-range Navigation (basin scales): Low-frequency (~20 Hz). Small numbers, large and costly. • Medium-range Navigation (O(100 km)): 200-1000 Hz, encoded position. Moorings and ice tethered platforms, homing. • High-bandwidth Communications: 15-30 kHz, ranges of a few kilometers. Data transfer, carried by all platforms.
The Road Ahead • Recover moored array (autumn) and gliders (spring/summer) 2007. • Joint UW-BIO IPY proposal to continue measurement program in Davis Strait, collaborate with EU DAMOCLES in Fram Strait- simultaneous monitoring of critical outflow gateways. • Tentative indication that Davis Strait IPY project will be funded- would continue measurement program through autumn 2010. • Continued development of gliders, navigation and communication systems for working under ice. • ICECAT shelf moorings, new ideas for low-cost moorings deployed through the ice. Focus on shallow shelves, ice-ocean interface, logistical ease.
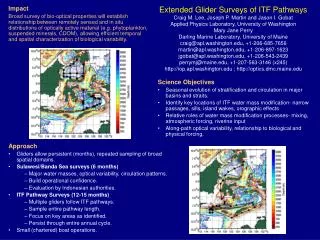
Gulf of Alaska (Northeast Pacific GLOBEC) • Surveys of Alaska Stream and eddies • Mission lengths 4 – 5 months • Deploy and recover from chartered fishing vessel • Satellite altimetry guides glider repeatedly across translating eddy • Attempted surveys in Alaska Coastal Current- shallow water, surface velocities 1.0 – 1.5 m/s, depth average 0.5 m/s