Download
1 / 45
490 likes | 723 Vues
Ionospheres of the Terrestrial Planets. Stan Solomon High Altitude Observatory National Center for Atmospheric Research stans@ucar.edu. Outline. • Introduction to Earth’s ionosphere • Overview of Earth’s atmosphere • Ionization processes • Chemical processes • Mars & Venus

E N D
Ionospheres of the Terrestrial Planets Stan Solomon High Altitude Observatory National Center for Atmospheric Research stans@ucar.edu
Outline • Introduction to Earth’s ionosphere • Overview of Earth’s atmosphere • Ionization processes • Chemical processes • Mars & Venus • Why is Earth so different?
Reflection of Radio Waves by the Ionosphere Reflection starts at the “Critical Frequency”, which is when the radio frequency equals the plasma frequency. (f0 in megahertz, ne in cm-3)
Atmospheric Density Distribution If T, M, and g are not functions of z: Mixed atmosphere (below ~100 km): M is the mean molecular weight of atmospheric gases Diffusively separating atmosphere (above ~100 km): mi is the molecular weight of individual species — Each species follows its own scale height.
Column Density Column Density: the number of molecules per unit area in a column above z0: Approximation for constant H:
Time Out to Think Suppose that a satellite is in low-Earth orbit at 300 km altitude. If the temperature of the thermosphere increases (for instance, as a result of an increase in solar ultraviolet radiation) then the density at 300 km will: Increase Decrease
Where does ionization occur in an atmosphere? Controlled by cross sections of atmospheric gases for absorption (s) and ionization (si). Which are in general a function of wavelength (l). For a single-species, plane-parallel atmosphere, at any particular l: Ionization Rate = (radiation intensity) x (ionization cross section) x (density) Beer’s law: where tz is the optical depth: and m = cos (solar zenith angle)
Basic Altitude Structure of the Earth’s Ionosphere What is all this ionization doing way up in here in the “F region” ??
Types of Ionospheric Chemical Reactions Radiative Recombination X+ + e- X + hn slow, rate coefficients of the order of 10-12 cm3 s-1 Dissociative Recombination XY+ + e- X + Y fast, rate coefficients of the order of 10-7 cm3 s-1 Charge Exchange WX+ + YZ WX + YZ+ moderately fast, rate coefficients of the order of 10-10 cm3 s-1 Atom-Ion Interchange X+ + YZ XY + Z+ rate depends on the strength of the YZ bond
Simple Case – Single Species Molecular Atmosphere M2 + hn M2+ ionization rate q M2+ + e- M + M rate coefficient a Assuming photochemical equilibrium: q = a [M2+] [e-] Assuming charge neutrality: [e-] = (q/a)1/2 This formula approximates densities in the “E region” of Earth’s ionosphere, since it is mostly molecular ions, photochemical equilibrium applies, and most dissociate recombination rates are similar (i.e., very fast).
Complicated Case – Earth’s F-Region Ionosphere Because of the decrease in molecular densities, the photochemical lifetime of O+ becomes longer than the diffusion lifetime (time it takes to move a scale height in the vertical direction) above ~200 km. Thus, the F region is not a simple Chapman layer caused by the absorption of radiation, but rather a balance between chemical production at lower altitude and ambipolar diffusion at higher altitude. The long lifetime of O+ at high altitude is also why the F2 region persists at night.
Ionospheres of Other Terrestrial Planets Model simulations (solid lines) and in-situ measurements from Viking-I for the dayside ionosphere of Mars.
Ionosphere of Venus Model simulations (above) and in-situ measurements (right) made on Pioneer Venus.
Why are the ionospheres of Mars and Venus, although similar to each other, so different from Earth? N2+, O2+ and O+ are the most abundantly produced ions in Earth’s ionosphere because N2, O2and O are the most abundant neutral species in the lower part of thermosphere. However, the most abundant ions below 300 km are O+,NO+, and O2+ On Mars and Venus the most abundantly produced ions are CO2+ and O+, but the most abundant ions are O2+ and O+. Unlike Earth, there is no “F2 region”, and very little ionization at night. — Why doesn’t O+ have a longer lifetime on Mars and Venus? — Why is there so much O2+ when there’s so little O2 in their atmospheres?
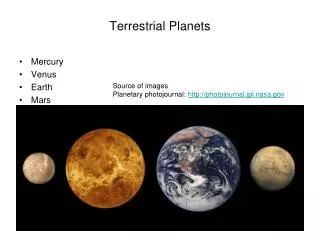
Atmospheric Composition of the Terrestrial Planets The atmospheres of Earth, Venus and Mars contain many of the same gases, but in very different absolute and relative abundances. Some values are lower limits only, reflecting the past escape of gas to space and other factors.
Principal Ionization Processes on Venus & Mars hn hn CO2 O CO2+ O O+ e CO2 O CO + O Weak bond, fast reaction O2+ Another fast reaction e O + O
Venus and Mars are “Normal”, Earth is Anomalous On Venus and Mars, O+ reacts rapidly with CO2 and CO2+ reacts rapidly with O because these atom-ion interchange reactions have fast rate coefficients. This is because CO2 is not very strongly bonded, compared to N2. Therefore, Venus and Mars ionospheres are “E region” (or “F1 region”) types, controlled mostly by photochemical equilibrium at their peaks. Earth lacks sufficient carbon in its atmosphere, and doesn’t have enough O2 at high altitude, for this to happen. Atom-ion interchange of O+ with N2 is very slow, due to the strength of the N2 bond. This creates the high, dense, persistant “F2 region” and a lot of interesting ionospheric variability.
Time Out to Think A high, dense, “F2 layer” ionosphere observed on a terrestrial-type planet would be a sign of life on that planet. True False