Tidal Influence and Marsh Inundation Analysis in Delaware River Region
This report investigates marsh inundation patterns in the Delaware River, specifically the Bowers, Frederica, and Webbs Slough areas. It utilizes data from the State Wetlands Mapping Program to analyze cumulative probabilities of tidal influences on land surfaces at various elevations. The study focuses on the distance upriver, platform elevations, and the fraction of time water levels remain below specific thresholds. It emphasizes the importance of wetland habitats and their vulnerabilities to tidal changes and land surface inundation.

Tidal Influence and Marsh Inundation Analysis in Delaware River Region
E N D
Presentation Transcript
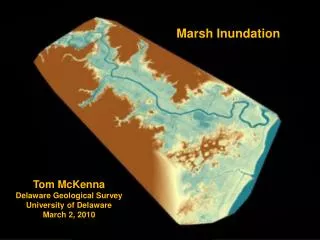
Marsh Inundation Tom McKenna Delaware Geological Survey University of Delaware March 2, 2010
Marsh Zones Distance upriver (km)
Cumulative Probability of Tide in River Being Below an Absolute Elevation Bowers Frederica Webbs Slough MTL MLLW MLW 75th % Tide Range at Bowers ~ 1.5 m phase lag (low tide) Bowers to Frederica = 103 min median Fraction of time water level below given elevation Bowers Frederica Webbs Slough Marsh Platform Elevation 25th % MHHW MHW 0.2 m 1.4 m 0.7 m -1.5 2.5 Elevation (m) Bowers tidal datums from VDatum
Land Surface Inundated Land Surface Inundated downstream upstream 4. Webbs Marsh (west) 6. Webbs Marsh (east)
Land Surface Inundated Land Surface Inundated downstream upstream
Land Surface Inundated Land Surface Inundated downstream upstream
Land Surface Inundated Land Surface Inundated downstream upstream
Land Surface Inundated Land Surface Inundated downstream upstream
Land Surface Inundated Land Surface Inundated downstream upstream
Depth at tide level = 0.3 m 0.6 m Bowers Frederica Webbs Slough Fraction of time water level below given elevation MHW MHHW -1.5 2.5 Elevation (m)
0.4 m 0.6 m Bowers Frederica Webbs Slough Fraction of time water level below given elevation MHW MHHW -1.5 2.5 Elevation (m)
0.5 m 0.6 m Bowers Frederica Webbs Slough Fraction of time water level below given elevation MHW MHHW -1.5 2.5 Elevation (m)
0.6 m Bowers Frederica Webbs Slough Fraction of time water level below given elevation MHW MHHW -1.5 2.5 Elevation (m)
0.7 m 0.6 m Bowers Frederica Webbs Slough Fraction of time water level below given elevation MHW MHHW -1.5 2.5 Elevation (m)
0.8 m 0.6 m Bowers Frederica Webbs Slough Fraction of time water level below given elevation MHW MHHW -1.5 2.5 Elevation (m)