Download
1 / 81
810 likes | 1.1k Vues
National Weatherization Assistance Program Evaluation. David Carroll Jackie Berger NEUAC Conference June 10, 2013. Presentation Outline. Evaluation Overview WAP 2008 / ARRA 2010 Research Tasks and Reporting Status Field Studies Process Performance Energy Impacts

E N D
National Weatherization Assistance Program Evaluation David Carroll Jackie Berger NEUAC Conference June 10, 2013
Presentation Outline • Evaluation Overview • WAP 2008 / ARRA 2010 • Research Tasks and Reporting Status • Field Studies • Process • Performance • Energy Impacts • Energy Savings / Cost Savings / Cost Effectiveness • Non-Energy Impacts • Client • Societal • Summary 2
What is WAP? The Weatherization Assistance Program has been in operation for over thirty years and is the nation’s largest single residential energy efficiency program. It’s primary purpose, established by law, is “…to increase the energy efficiency of dwellings owned or occupied by low-income persons, reduce their total residential energy expenditures, and improve their health and safety, especially low-income persons who are particularly vulnerable such as the elderly, the persons with disabilities, families with children, high residential energy users, and households with high energy burden.” 4
WAP Logistics • DOE: Grants to states and territories • States: Grants to local weatherization agencies – sometimes supplementing with LIHEAP, State, and/or Utility funds • Local Agencies: Deliver services – sometimes coordinating with LIHEAP, Local and/or Utility SBC programs 5
WAP Services • Typical Weatherization Measures • Air Sealing: Attics, ducts, windows • Insulation: Attics, walls, rim joists • Furnace: Tune-up, repairs, replacement • Other Energy Efficiency Measures • Water Heating: Pipe wrap, showerheads • Electric Measures: Refrigerators, CFLs • Air Conditioning: Tune-up, repairs, sealing 6
WAP Services • Energy efficiency measures need a savings to investment ratio (SIR) of 1.0 or greater • Spending limits mean that sometimes measures with a SIR > 1.0 are not installed 7
WAP Services • Health and Safety Measures • Combustion Appliances: Furnace, Water Heater, Stove/Oven, Dryer • Moisture Management: Kitchen and Bathroom Ventilation, Dryer Vents • Health and Safety measures are subject to limits identified in each state WAP Plan 8
WAP Funding • WAP pre-ARRA (PY2008) • WAP Budget = $250 million • Annual Goal = 100,000 homes • Limit on Average Investment = $3,000 per home • Income Limit = 150% of poverty (or 60% state median) • ARRA Funded WAP • ARRA Budget = $5 billion • Accomplishments = Over 1 million homes weatherized • Limit on Average Investment = $6,500 per home • Income Limit = 200% of poverty 9
Evaluation Goals • Impact • Energy Savings: Measure gas, electric, fuel oil, and LPG savings • Cost Savings: Measure first year and measure life savings • Nonenergy Benefits: Client and societal • Cost-Effectiveness: Energy and nonenergy benefits • Process • Administrative: Document program implementation • Field Studies: Observe audits, installation, and inspections • Case Studies: Identify innovative approaches to weatherization 10
Evaluation Activities • States/Agencies • Grantee Survey – 51 States and the District of Columbia • Subgrantee Survey – 900 Agencies delivering services • Client Data: Collected information for about 60,000 clients • Energy Data • Gas Data: 30,000 clients in 400 gas utilities • Electric Data: 50,000 clients in 1,000 utilities • Fuel Oil/LPG: Metering studies 11
Evaluation Activities • Field Studies • Indoor Air Quality Study: On-site measurement in 500 homes • Field Process Study: Observations in 19 agencies nationwide • Case Studies: Observations of ten innovative programs • Performance Study: Assessment of under/over performance • SERC Studies: New technology assessments • WIPP Studies: Innovative approaches assessments • Surveys • Occupants: 1,125 treatment, 800 comparison • Weatherization Staff : 350 auditors, 260 crew chiefs, and 260 crew 12
Evaluation Timing • PY 2008 Evaluation • Program Year: April 2008 – March 2009 • Data Collection and Analysis: May 2010 to January 2011 • Reporting: Summer 2013 • ARRA Evaluation • Program Year: April 2010 – March 2011 • Data Collection and Analysis – July 2012 to June 2013 • Reporting: Fall 2013 13
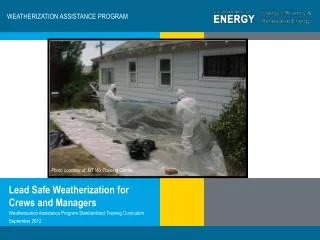
Field Process Study Tasks • Social Scientists • One week observation at agency • Weatherization manager and staff interviews • Observations –intake, audit, installation, final inspection • Written agency summary report • Weatherization Experts • 3-Week Observations at Agency • Observations – audit, installation, final inspection • Post Observation Data Entry • Training • Monthly update calls • Final debriefing 15
Field Process Study Focus • Audit approach and implementation • Energy education delivery • Measure installation/operation of crews • Post-weatherization quality assurance inspection approach and implementation • Client interaction • Interactions among agency staff • Implications for management, procedures, and training 16
Field Process Study Approach • Go beyond anecdotes • Quantify findings across all visits • Develop check lists and rating scales • Train weatherization experts to implement consistently • Enrich data with descriptive information • Examples used to illustrate and clarify • Not used to draw conclusions • Make recommendations for program improvement based on prevalent issues 17
Field Process Study Challenges • Program differs in every state – how to assess jobs? • Consistent implementation of assessment tool • Design, training, data review • Remaining observers, rather than trainers, coaches, mentors 18
Audit Findings • Opportunities • Utilize energy bills • Increase client engagement • Identify client-specific opportunities for reducing energy use • Auditor understanding of pressure boundaries • Auditor understanding of testing purpose and procedures • Conduct worst case draft testing • Strengths • Respect and concern for clients • Explanation of WAP program and process • Use of data collection forms • Auditors meet with contractors to explain audit findings and work scope 20
Installation Findings • Opportunities • Increased use of blower door when air sealing • Respect for clients’ homes (booties, covering furniture) • Crew member safety • Increased assessment of HVAC contractors • Explain CFLs when installing • Client education • Strengths • Crew flexibility and dedication • Crew problem solving • Some very high quality work • Experienced HVAC contractors 21
Final Inspection Findings • Opportunities • Increased client education • Explain measures installed • Reinforce client action plan • Improved testing quality • Increased assessment of installation quality • Reduced use of auditor to conduct final inspection – additional perspective • Strengths • Good job when following work order closely • Time saved when contractor attends • Information to clients – who to call if they have problems • Referrals to additional assistance programs 22
Recommendations • Training • Energy bill utilization – to assess needs and educate clients • Building science fundamentals • Critical thinking – assessing unique situations • Combustion safety testing • Zonal pressure testing • IR camera use • Ventilation assessment • Safe work practices – worker safety and lead safe work • Interviewing skills – how to understand the client’s needs • Client education • Equipment Needs • GPS • IR camera • Boroscope and fiber optic scope and video • Personal safety equipment • Management Opportunities • Standards and procedures • Policy manuals • Forms and checklists 23
Performance StudyNote: Slides Prepared by Scott Pigg, Energy Center of Wisconsin 24
Study Overview • Study Design / Implementation • Focus on Single Family Homes • Identify Energy Savings Outliers • Develop Geographic Clusters • Sample 20 Clusters Nationwide • Recruit and Inspect 6 Homes Per Agency • Document Findings for Individual Homes • Summarize Findings for Population 25
Study Overview • Question – What factors lead to under/ over-performance relative to the model? • Program Targeting? • Treatment Protocols? • Measure Selection? • Installation Quality/Completeness? • Measurement Error? • Client Take-Back/Give-Back? • Answer – Yes … but how much of each? 26
Ceiling insulation • Floor insulation • Air leakage reduction from 2,000 to 1,500 CFM50 • Heating system replacement 7012--0118 (MO) 636
Ceiling insulation (4 bags) • Floor insulation (2 bags) • Air leakage reduction from 2,000 to 1,500 CFM50(measured 2,100 at time of visit) • Heating system replacement (gas heater broke year before Wx) • …and client reported keeping thermostat set higher afterWx (for health reasons)
Net change in indoor temperature following Weatherization: +0.27 ± 0.23F
Attic insulation (R-11 to R-38) • Floor insulation (R-25 over garage) • Air leakage reduction from 3,030 to 2,200 CFM50 • Ill-defined pressure thermal/pressure boundary • Significant duct leakage • Electric space heater use
Attic insulation (R-5 to R-38) • Garage ceiling (10” dense-pack) • Air leakage reduction from 2,040 to 1,300 CFM50
Uninsulated slopes and side atticsbrought up to R-19 and R-38 • Wall insulation (interior blow) • Condensing furnaces (2) • Air leakage reduction from 4,890 to 3,940 CFM50 5666-0367(WI) 2426
Client reduced temperaturefrom 77 to 70F • Upstairs no longer occupiedor heated • Some electric space heat use(more prior to Wx)
Pre-weatherization Gas Consumption 2,430 therms/yr 1,170 therms/yr 1,140 therms/yr 420 therms/yr 270 therms/yr 442 therms/yr
Preliminary Observations • We found that… • Homes with low pre-usage have low savings / but you need to serve some of these homes anyway. • Good work in homes with savings potential leads to high savings • Doing only part of the job leads to missed savings / and sometimes savings opportunities are missed. • Behavior change goes both ways / cold homes get heated / comfortable homes reduce settings 44
Energy ImpactsNote: Slides prepared by David Carroll, APPRISE; Michael Blasnik, Blasnik & Associates; and, Greg Dalhoff, Dalhoff Associates, LLC 45
Study Scope • Primary Focus • Detailed analysis of Program Year 2008 • WX Program Year – 4/2008 to 3/2009 • State Program Year – 7/2008 to 6/2009 • Supplemental Information • Usage analysis only for Program Year 2007 • Preliminary Information • Usage analysis for clients served in the first half of Program Year 2009
Logistical Challenges • What clients were served by the program? • Collection of client account information from 51 grantees and 400 subgrantees for PY 2007, 2008, and 2009 clients • What services did those clients receive? • Collection of detailed information on service delivery for program year 2008 for about 19,000 clients • What is the energy usage of the home before and after weatherization? • Collection of usage data for 57,000 clients from 4/1/2006 through 3/31/2011.
Usage Data Requirements • PY 2008 Clients • Weatherized between 4/2008 and 6/2009 • Pre-weatherization usage = 12 months prior to weatherization (as early as 4/2007 through 3/2008) • Post-weatherization usage = 12 months after weatherization (as late as 7/2009 through 6/2010) • Data required for analysis of PY 2008 from April 2007 through June 2010 = 39 Months of Usage Data • PY 2007 Clients – Need data from 4/06 through 6/09 • PY 2009 Clients – Need data from 4/08 through 6/11
Usage Data Collection • Natural Gas Main Heat • Sample of 15,000 clients per program year • Total sample of 45,000 clients for PY 07, PY 08, and PY 09 • Requested data from 368 gas utilities for 45,000 clients • Received data from 71% of utilities for 30,000 clients (67%) • Natural Gas and Electric Main Heat • Sample of 19,000 clients per program year • Total sample of 57,000 clients for PY 07, PY 08, and PY 09 • Requested data from 984 electric suppliers for 57,000 clients • Received data from 74% of utilities for 37,000 clients (67%)
Analysis Challenges • Differences in Weather from Pre-Program Year to Post-Program Year • Use of PRISM (variable base degree day) approach to compare “Weather Normalized” consumption for the two periods • Other factors affecting low income households • Use of a Comparison Group • PY 2008 clients serve as a comparison group for PY 2007 analysis • PY 2009 clients serve as a comparison group for PY 2008 analysis • PY 2007/08 clients served as comparison group for PY 2009 • Attrition from incomplete data or inconsistent data • Use of ORNL model • Use of Fixed Effects regression model