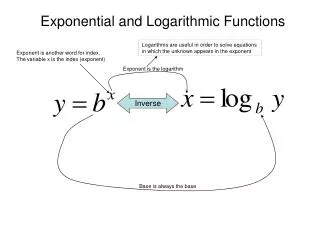
EXPONENTIAL AND LOGARITHMIC FUNCTIONS
EXPONENTIAL AND LOGARITHMIC FUNCTIONS. Revision : Indices. Examples. a). 3 4 = 3 × 3 × 3 × 3 = 81. b). Solve 2 n = 1024. Try 2 8 = 256. (too low). (too low). 2 9 = 512. . 2 10 = 1024. n = 10. c). Find the smallest integer value of n such that 3 n > 10 000.

EXPONENTIAL AND LOGARITHMIC FUNCTIONS
E N D
Presentation Transcript
Revision : Indices Examples a) 34 = 3 × 3 × 3× 3 = 81 b) Solve 2n = 1024 Try 28 = 256 (too low) (too low) 29 = 512 210 = 1024 n = 10
c) Find the smallest integer value of n such that 3n > 10 000. Try 37 = 2187 ( < 10 000) 38 = 6561 ( < 10 000) 39 = 19683 ( > 10 000) n = 9
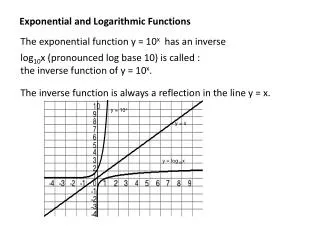
Graphs of ax – Exponential Functions y = ax For y = ax if a > 1 The graph: • Is always positive • Never crosses the x-axis • Is increasing (0,1) • Passes through (0,1) • Is called a growth function
For y = ax if 0 < a < 1 y = ax The graph: • Is always positive • Never crosses the x-axis • Is decreasing • Passes through (0,1) (0,1) • Is called a decay function Notes: y = ax - is called an exponential function - has base a - a 0
Examples a) If you deposit £100 at the Northern Rock Bank, each year the deposit will grow by 15% (compound interest). i. Find a formula for the amount in the bank after n years. ii. After how many years will the balance exceed £500? i. After year 0: y0 = £100 After year 1: y1 = y0× 1.15 = £115 After year 2: y2 = y1× 1.15 = (1.15)2× 100 = £132.25 After year 3: y3 = y2× 1.15 = (1.15)3× 100 = £152.0875 Formula : yn = (1.15)n× 100
ii. After how many years will the balance exceed £500? Try n = 9 : y9 = (1.15)9× 100 = £351.7876292 Try n = 10 : y10 = (1.15)10× 100 = £404.5557736 Try n = 11: y11 = (1.15)11× 100 = £465.2391396 Try n = 12: y12= (1.15)12× 100 = £535.0250105 The balance will exceed £500 after 12 years.
b) The rabbit population on an island increases by 12% per year. i. Find a formula for the number of rabbits on the island after n years. ii. How many years will it take for the population to at least double? i. r0 After year 0: After year 1: r1 = r0× 1.12 After year 2: r2 = r1× 1.12 = (1.12)2× r0 Formula : rn = (1.12)n× r0
ii. For the population to at least double : (1.12)n > 2 (too low) Try: (1.12)3 = 1.404928 (too low) Try : (1.12)4 = 1.57351936 (too low) Try : (1.12)5 = 1.762341683 (too low) Try : (1.12)6 = 1.973822685 Try : (1.12)7 = 2.2106841407 ( > 2 ) Population will double within 7 years.
3. Exponential Functions If we plot f (x) and f `(x) for f (x) = 2x: If we plot f (x) and f `(x) for f (x) = 3x: f (x) f `(x) f `(x) f (x) (0,1) (0,1) We can see that f `(x) is below f (x). We can see that f `(x) is above f (x). For some value between 2 and 3, f (x) = f `(x).
If we plot f (x) and f `(x) for f (x) = 2.7x: If we plot f (x) and f `(x) for f (x) = 2.8x: f (x) f `(x) f `(x) f (x) (0,1) (0,1) We can see that f `(x) is justbelow f (x). We can see that f `(x) is justabove f (x).
From these graphs we can see that: • If f(x) is an exponential function then f `(x) is also an exponential function • f `(x) = k f (x) • A value exists between 2.7 and 2.8 for which f ` (x) = f (x) f (x) = f `(x) = ex This value is: 2.718….. This value is denoted by: e If f (x) = ex then f `(x) = ex (0,1) f (x) = 2.718x = ex is called the exponential function to the base e
Examples a) Evaluate e5. b) Solve for x, ex = 5. x = 1.609437912 e5 = 148.4131591 = 1.61 (2dp) = 148.4 (1dp)
log4 64 = 3 log2 32 = 5 log8 p = 2 b) Express the following in exponential form: i) log28 = 3 i) log21/128 = -7 1/128 8 = 23 = 2-7 Examples a) Write the following in logarithmic form: i) 43 = 64 ii) 25 = 32 iii) p = 82 (Check: 2 × 2 × 2 = 8)
Evaluate: a) log 2 8 b) log 3 1 c) log 2 1/16 Laws of Logarithms Law A: log a a n = n
Law B: Law C: Law D:
Logarithmic Equations Rules learned can now be used to solve logarithmic equations. log 3 x + log 3x3 – (log 3 8 + log 3x) = 0 log 3 x + log 3x3 – log 3 8 - log 3x = 0 log 3x3 – log 3 8 = 0 log 3x3 = log 3 8 x3 = 8 x = 2
2) log 4 x + 2 log 4 3 = 0 3) 32x-7 = 243 35 = 243 log 4 x + log 4 32 = 0 log 4x = - log 4 32 5 = 2x - 7 log 4x = log 4 3-2 2x - 7 = 5 x = 3 -2 2x = 12 x = 1/32 x = 6 x = 1/9
Natural Logarithms Logarithms to the base e are called natural logarithms. log ex = ln x i.e. log 2.718x = ln x Examples Solve the following, rounding correct to 1 d.p.: a) lnx = 5 b) e x = 7 (Take natural logs of each side) log ex = 5 ln e x = ln 7 xlogee = ln 7 x = e 5 x = 148.41316 x = ln 7 x = 148.4 (1dp) x = 1.9459101 x = 1.9 (1dp)
c) 37x+2 = 30 d) For the formula P(t) = 50 e -2t ln 3 7x+2 = ln 30 i) Evaluate P(0). (7x+2) ln 3 = ln 30 ii) For what value of t is P(t) = ½ P(0)? 7x+2 = ln 30/ln 3 i) P(0) = 50 e –2(0) 7x+2 = 3.0959033 = 50 e 0 7x = 1.0959033 = 50 x = 0.1565576 ii) ½ P(0) = 25 50 e -2t = 25 x = 0.2 (1dp) e -2t = ½ Remember: ln e = loge e ln e -2t = ln ½ -2t = -0.6931471 t = 0.3465735 t = 0.3 (1dp)
y x Formula from experimental data • If data from an experiment is analysed, say x and y, and plotted, and it is found to form a straight line then x and y are related by the formula: y = mx + c • If data from an experiment is analysed, say x and y, and plotted, and it is found to form an exponential growth curve then x and y are related by the formula: y = k xn (k and n are constants)
Using logarithms y = k xn can be expressed as a straight line. y = k xn log 10 y = log 10 k xn log 10 y = log 10 k + log 10xn log 10 y = log 10 k + n log 10x log 10 y = n log 10x + log 10 k Y = mX + C Where: Y = log 10 y If y = k xn X = log 10x C = log 10 k Then log 10 y = n log 10x + log 10 k n = gradient
When / why do we use this? • If we are given two variables of data (x and y) related in some way and when plotted they produce an experimental growth curve, through (0,0), then the previously given formula can be used to work out k and n. This can then be used to decide the formula to relate them (y = k xn). • If we are given two variables of data in logarithmic form (log 10 x and log 10y) and when plotted a straight line is produced then it can be said that the original data (x and y) would produce an exponential growth curve. If it passes through (0,0) the previously given formula can be used to calculate k and n and hence find the formula relating them(y = k xn).
Example Experimental data are given in the table: 2.4 5.62 18.2 31.6 129 x y 8.3 26.3 115 209 1100 i) Show that x and y are related in some way. ii) Find the values of k and n (to 1dp) and state the formula that connects x and y. log10 x 0.38 0.75 1.26 1.50 2.11 i) log10 y 0.92 1.42 2.06 2.32 3.04
As a straight line is produced when log 10 x is plotted against log 10 y then the formula relating x and y is of the form y = k xn.
ii) Take 2 points on best fitting straight line:(0.38,0.92) & (2.11,3.04) Put them into Y = nX + C, where Y=log10y, X=log10x, C=log10k. 0.92 = 0.38n + C Substitute 1.225… into 1 1 3.04 = 2.11n + C 2 0.92 = 0.38(1.225…) + C 0.92 = 0.46566… + C 2 - 1 C = 0.4543352601 2.12 = 1.73n C = log 10 k n = 1.225433526 log 10 k = 0.45433… n = 1.2 (1dp) k = 10 0.45433… k = 2.846657779 k = 2.8 (1dp) Formula relating x and y is: y = k xn y = 2.8 x1.2
Steps: i) Make a table of log10x and log10y. ii) Plot log10x against log10y. iii) If a straight line is produced then state that the form is y = k xn. iv) Choose 2 points from the best fit line (2 far apart are best). v) Substitute 2 points into Y = nX + C to form 2 equations. vi) Solve by simultaneous equations. vii) Value for n can be used in final formula. viii) Value for C is used to calculate k (i.e. C = log10k k =10C). ix) State complete formula : y = k xn.
Steps: Version 2 i) Make a table of log10x and log10y. ii) Plot log10x against log10y. iii) If a straight line is produced then state that the form is y = kx n. iv) Choose 2 points from the best fit line (2 far apart are best). v) Use these two points to find the gradient. This will give you n. vi) Use one of the points and y – b = m(x – a) to find the equation of the line. vii) You now have the value of C. viii) Use the value for C to calculate k (i.e. C = log10k k =10C). ix) State complete formula : y = k xn.
y = ex y = x y = ln x Related Graphs The rules previously learned for graph manipulation can be applied to logarithmic and exponential curves. As ex and ln x are opposite operations (inverse) then the graph of y = ln x is a reflection of y = ex about y = x.
y = ex+a 4 y 4 y y = ex y = ln (x+a) 3 3 2 y = ln x a Shift up ‘a’ 1-a 1 2 x -6 -4 -2 2 4 6 Shift left ‘a’ 1 -1 x -2 -2 -1 1 2 -3 -1 -4 4 y 4 y y = e-x y = ln x 3 y = ex 3 2 2 1 x -1 1 2 3 4 5 6 1 -1 x -2 y = -ln x -2 -1 1 2 -3 -1 -4 Reflection in x-axis Reflection in y-axis
y = ex 4 y y = e(x-b) 3 Shift right ‘b’ 2 (b,1) 1 x -4 -3 -2 -1 1 2 3 4 -1 y = a ln x 4 y 3 y = ln x 2 1 x -1 1 2 3 4 5 6 -1 -2 Stretch by ‘a’ about the x-axis -3 -4
Examples a) Sketch the graph of y = log 2x. i) On the same diagram sketch y = log 21/x . y = log2x y = log 21/x y = log 2x y = log 2x -1 x = 2 y y = -log 2x If y = 0, x = 1 Graph is a reflection of y = log 2x about the x-axis. If y = 1, x = 2 ( 1 , 0 ) , ( 2 , 1 ) y = log21/x
ii) Sketch the graph of y = log 2x again. On the same diagram sketch y = log 2 2x. y = log 2 2x y = log 2 2 + log 2x y = log22x y = 1 + log 2x y = log2x Graph of y = log 2x moves up 1 place. Crosses x-axis when y=0 1 + log 2x = 0 log 2x = -1 x = 2 -1 x = ½. ( ½ , 0)
Further Formula from Experimental Data • If data from an experiment is analysed, say x and y, and plotted, and it is found to form an exponential growth curve then x and y are related by the formula: y = a b x (a and b are constants)
Using logarithms y = a b xcan be expressed as a straight line. y = a b x log 10 y = log 10 a b x log 10 y = log 10 a + log 10 b x log 10 y = log 10 a + x log 10 b log 10 y = x log 10 b + log 10 a Y = mx + c Where: Y = log 10 y If y = a b x x = x c = log 10 a Then log 10 y = x log 10 b + log 10 a m = log 10 a
When / why do we use this? • If we are given two variables of data (x and y) related in some way and when plotted they produce an experimental growth curve, through (0,+?), then the previously given formula can be used to work out a and b. This can then be used to decide the formula to relate them (y = a b x). • If we are given two variables of data in logarithmic form (x and log 10y) and when plotted a straight line is produced then it can be said that the original data (x and y) would produce an exponential growth curve. If it passes through (0,+?) the previously given formula can be used to calculate a and b and hence find the formula relating them(y = a b x).
Example Experimental data are given in the table: 2.15 2.13 2.00 1.98 1.95 1.93 x y 83.33 79.93 64.89 62.24 59.70 57.26 i) Show that x and y are related by the formula y = a b x. ii) Find the values of a and b (to 1dp) and state the formula that connects x and y. x 2.15 2.13 2.00 1.98 1.95 1.93 i) log10 y 1.921 1.903 1.812 1.794 1.776 1.758
As a straight line is produced when x is plotted against log 10 y then the formula relating x and y is of the form y = a b x.
ii) Take 2 points on best fitting straight line:(2.15,1.921) & (1.93,1.758) Put them into Y = mx + c, where Y=log10y, x=x, m = log10b, c=log10a. 1.921 = 2.15m + c Substitute m = 0.740909 into 1 1 1.758 = 1.93m + c × -1 2 1.921 = 2.15(0.740909) + c 1.921 = 2.15m + c 1.921 = 1.5929545 + c 1 -1.758 = -1.93m - c 3 c = 0.3280454 0.163 = 0.22m m = 0.740909 m = log 10 b log 10 b= 0.740909 b = 10 0.740909 b = 5.5069241 b= 5.5 (1dp)
c = log 10 a log 10 a = 0.3280454 a = 10 0.3280454 a = 2.1283618 a= 2.1 (1dp) Formula relating x and y is: y = a b x y = 2.1 (5.5) x
Steps: i) Make a table of x and log10y. ii) Plot x against log10y. iii) If a straight line is produced then state that the form is y = a b x. iv) Choose 2 points from the best fit line (2 far apart are best). v) Substitute 2 points into Y = mx + c to form 2 equations. vi) Solve by simultaneous equations. vii) Value for m is used to calculate b (i.e. m = log10b b = 10m). viii) Value for c is used to calculate a (i.e. c = log10a a = 10c). ix) State complete formula : y = a b x.