Download
1 / 28
280 likes | 300 Vues
Review of ecosystem models for Lake Erie phosphorus objectives to assess model performance in reproducing real-world patterns and identifying strengths and limitations for aquatic watershed management.

E N D
Overview of Ecosystem Models Selected for the Ensemble Modeling Approach SAB Lake Erie Phosphorus Objectives Review Meeting December 10, 2014
How well do our models reproduce “real world” patterns? Aquatic Watershed Water Quality Water Quantity Number of studies Model performance Model performance
Phytoplankton Functional Group Modelling Model performance Characterization of functional properties Considerable inconsistency exists with respect to the characterization of the properties (growth strategies, nutrient kinetics) of algal functional groups
Simple Mechanistic Models Benefits:+ easier to quantify uncertainty + easier to analyze + easier to constrain Disadvantages:- oversimplified
Complex Mechanistic Models • Benefits:+ account for more processes+ more realistic • Disadvantages:- more parameters • more data needed to constrain the models • computationally demanding • difficult to perform uncertainty analysis P-cycle N-cycle
Chapra TP Mass Balance Model • Simple mass balance on TP in three Lake Erie Basins with a lumped net apparent TP settling velocity • Need to increase net TP settling velocity after 1990 • Uses TP – chlorophyll a regression to estimate August chlorophyll a levels
Chapra TP Mass Balance Model • Simple mass balance on TP in three Lake Erie Basins with a lumped net apparent TP settling velocity • Need to increase net TP settling velocity after 1990 • Uses TP – chlorophyll a regression to estimate August chlorophyll a levels
EcoLE Model • 2D (laterally-averaged) hydrodynamic and water quality model (CE-QUAL-W2 framework) • Biological submodels include phytoplankton, zooplankton, and dreissenid mussels (grazing and excreting nutrients) • Non-diatom edible algae, non-diatom inedible algae, and diatoms • Cladocera and copepods
Model Performance Best: Diatom biomass (8 cases with good agreement) Worst: Copepods Total Dissolved Phosphorus (5 cases with non-significant differences (p>0.05) Strength: Performance of the model was encouraging Limitation/Recommendation: Model complexity makes it more suitable as an analytical/heuristic tool than as a predictive device to support ecosystem forecasts
- The decision to include light limitation within Liebig's Law of the Minimum may be problematic, as it is likely to have overstated the role of light availability as the predominant factor that shapes the competitive strength of the three functional groups considered;- The 2-D spatial segmentation disallows the simulation of the nearshore–offshore gradients, while the fact that dreissenids are effectively treated as a forcing function impedes the use of the model for predictive purposes.
Environment Canada 9-Box Eutrophication Model • The model has recently been used to simulate the P dynamics of Lake Erie after the arrival of zebra mussels • The main difference is an increased settling rate from 0.04 to 0.07 m day-1 • Besides increased settling of P, it was found that SRP is under-predicted in the spring in the Western Basin, likely due to faster rate of P recycling by dreissenids and the full mixing in the Western Basin.
ELCOM-CAEDYM Model • 3D whole lake linked hydrodynamic – biogeochemical model • Calibrated with 2002 data
Model Performance • Strength: Developed to assess the relative contribution of localized nutrient inputs to phytoplankton abundance in nearshore areas • Limitation: No rigorous assessment of the range of system dynamics that can be induced when accounting for uncertainty of within- and among- annual loading estimates
Model Performance • Limitation: Model calibration gives precedence to physical transportation processes (hydrodynamic model) over biological processes (ecological model). • Biological parameters (e.g., growth rates and kinetics) were general literature values and/or derived by tuning while the hydrodynamic model was activeRecommendation: Undertake an independent calibration of the ecological model and then integrate the two models.
Model Performance Very careful model calibration, including a comparison against empirical estimates of sedimentation, primary production, and oxygen depletion rates
Insights from the Model Variability in hydrothermal regime contributes five times more variance than does load seasonality
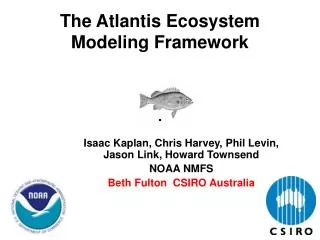
WLEEM Environmental Fluid Dynamics Code Simulating Waves Nearshore Sandia National Laboratory Advanced Aquatic Ecosystem Model
WLEEM – Total Chlorophyll a • Fine-scale 3D linked hydrodynamic-sediment transport-advanced eutrophication model for Western Basin • Total chlorophyll a is the sum of 3 modeled phytoplankton functional groups (diatoms, greens/others, cyanobacteria
WLEEM – Cyanobacteria • Corroborated using 4 years (2008, 2011-13) by comparison with Bridgeman data