Download
1 / 23
250 likes | 967 Vues
Learn how to effectively use BLAST for sequence analysis and aligning biological data. Discover how to segment query sequences, identify potential alignments, extend matches, and interpret scoring matrices.

E N D
BLAST Slides adapted & edited from a set by Cheryl A. Kerfeld (UC Berkeley/JGI) & Kathleen M. Scott (U South Florida) Kerfeld CA, Scott KM (2011) Using BLAST to Teach ‘‘E-value-tionary’’ Concepts. PLoS Biology 9(2):e1001014
Starts with a Query Sequence in FASTA Format Amino acid sequence: >ribosomal protein L7/L12 [Thiomicrospira crunogena XCL-2] MAITKDDILEAVANMSVMEVVELVEAMEEKFGVSAAAVAVAGPAGDAGAA GEEQTEFDVVLTGAGDNKVAAIKAVRGATGLGLKEAKSAVESAPFTLKEG VSKEEAETLANELKEAGIEVEVK Nucleotide sequence: >gi|118139508:333094-333465 Thiomicrospira crunogena XCL-2 ATGGCAATTACAAAAGACGATATTTTAGAAGCAGTTGCTAACATGTCAGTAATGGAAGTTGTTGAACTTGTTGAAGCAATGGAAGAGAAGTTTGGTGTTTCTGCAGCAGCAGTTGCGGTTGCAGGTCCTGCAGGTGATGCTGGCGCTGCTGGTGAAGAACAAACAGAGTTTGACGTTGTCTTGACTGGTGCTGGTGACAACAAAGTTGCAGCAATCAAAGCCGTTCGTGGCGCAACTGGTCTTGGGCTTAAAGAAGCGAAAAGTGCAGTTGAAAGTGCACCATTTACGCTTAAAGAGGGTGTTTCTAAAGAAGAAGCAGAAACTCTTGCAAATGAGCTTAAAGAAGCAGGTATTGAAGTCGAAGTTAAATAA Note the description line Starts with “>”, ends with carriage return Not read as sequence data 2 Kerfeld and Scott, PLoS Biology 2011
NCBI BLAST Interface(blastp: for protein-protein alignments) (Paste FASTA format sequence here) 3 Kerfeld and Scott, PLoS Biology 2011
NCBI BLAST Results Page:Potential homologs retrieved from database 4 Kerfeld and Scott, PLoS Biology 2011
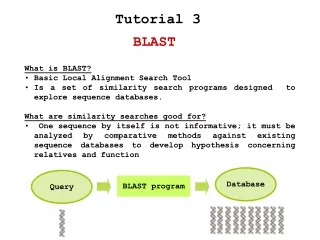
Overview of BLAST • Segment the query sequence into short “words” • Use the query sequence segments to scan the database for matching sequences • Extend the matched segments in either direction to find local alignments. • Create a list of hits & alignments, with best matches first 5 Kerfeld and Scott, PLoS Biology 2011
BLAST Phase 1: Segment the query sequence and identify words that could form potential alignments • Segment the query sequence into pieces (“words”) • Default word length: 3 amino acids or 11 nucleic acids • Create a list of synonyms and their scores for comparing query words to target words • Uses scoring matrix to calculate scores for synonyms that might be found in the database • Save the scores (and synonyms) exceeding a given threshold T 6 Kerfeld and Scott, PLoS Biology 2011
BLAST Phase 2: Using the query sequence word list, scan the database for synonyms (hits) • Scan the database for matches to the word list with acceptable T values • Require two matches (“hits”) within the target sequence • Set aside sequences with matches above T for further analysis Words SWI PGI …………..SWITEASFSPPGIM….. Possible match from the database 7 Kerfeld and Scott, PLoS Biology 2011
BLAST Phase 3: Extending the hits • Search 5’ and 3’ of the word hit on both the query and target sequence • Add up the score for sequence identity or similarity until value exceeds S • Alignment is dropped from subsequent analyses if value never exceeds S 8 Kerfeld and Scott, PLoS Biology 2011
So, to summarize: • BLAST segments query sequence into “words” and scores potential word matches • Scans this list for alignments that meet a threshold score T • uses a scoring matrix to calculate this (e.g., BLOSUM62) • Uses this list of ‘synonyms’ to scan the database • Extends the alignments to see if they meet a cutoff score S • uses a scoring matrix to calculate this • Reports the alignments that exceed S 9 Kerfeld and Scott, PLoS Biology 2011
PAM and BLOSUM Matrices • Scoring matrices are calibrated to capture different degrees of sequence similarity • In practice, this means choosing a matrix appropriate to the suspected degree of sequence identity between the query and its hits • PAM: empirically derived for close relatives • BLOSUM: empirically derived for distant relatives 10 Kerfeld and Scott, PLoS Biology 2011
Raw Scores (S values) from an Alignment S = (SMij) – cO – dG, where M = score from a similarity matrix for a particular pair of amino acids (ij) c = number of gaps O = penalty for the existence of a gap d = total length of gaps G = per-residue penalty for extending the gap 11 Kerfeld and Scott, PLoS Biology 2011
Limitations of Raw Scores • S values depend on the substitution matrix, gap penalties • Impossible to compare S values from hits retrieved from BLAST searches when different matrices and gap penalties are used 12 Kerfeld and Scott, PLoS Biology 2011
Going from Raw Scores to Bit Scores S’ = [lS-ln(K)]/ln(2) where S’ = bit score land K = normalizing parameters of the specific matrices and search spaces • Larger raw scores result in larger bit scores • Allows user to compare scores obtained by using different matrices and search spaces (as in 0 vs 1) 13 Kerfeld and Scott, PLoS Biology 2011
Limitations of Bit Scores • How high does a bit score have to be to suggest common ancestry? • Hard to evaluate hits as homologs or not, based solely on bit scores 14 Kerfeld and Scott, PLoS Biology 2011
E-value • Number of distinct alignments with scores greater than or equal to a given value expected to occur in a search against a database of known size, based solely on chance, not homology. • Large E-values suggest that the query sequence and retrieved sequence similarities are due to chance • Small E-values suggest that the sequence similarities are due to shared ancestry (or potentially convergent evolution) 15 Kerfeld and Scott, PLoS Biology 2011
Calculating E-values E = (n × m) / 2S’ where m = effective length of the query sequence = length of query sequence – average length of alignments (Controls for fewer alignments occurring at the ends of the query sequence) n = effective length of the database sequence (total number of bases) The value of E decreases exponentially with increasing S 16 Kerfeld and Scott, PLoS Biology 2011
Expect Word size Matrix Gap costs Filter Mask BLAST Parameters 17 Kerfeld and Scott, PLoS Biology 2011
E value Threshold Alignments will be reported with E-values less than or equal to the expect values threshold Setting a larger E threshold will result in more reported hits Setting a smaller E threshold will result in fewer reported hits 18 Kerfeld and Scott, PLoS Biology 2011
Filter and Mask • Filter: Low complexity • Replaces the following with N (nucleotides) or X (amino acids) • Dinucleotide repeats • Amino acid repeats • Leader sequences • Stretches of hydrophobic residues • Mask: Lower case • Replaces lowercase letters in sequence with N or X • Lowercase letters typically indicate base or amino acid not known with certainty 19 Kerfeld and Scott, PLoS Biology 2011
Parameter Summary is Found at the Bottom of the Output….. Kerfeld and Scott, PLoS Biology 2011
Evaluating BLAST Results 21 Kerfeld and Scott, PLoS Biology 2011
Examine the BLAST Alignment Does it cover the whole length of both the query and subject sequences? 22 Kerfeld and Scott, PLoS Biology 2011
High E-value: Discovery of aDistant Homolog or Garbage? • Take another look at the target (subject) sequence(s) that have high E-values • Similar length? • Recurring motifs? • Similar biological functions? • Use target sequences as query sequences for another BLAST search • Does the original query sequence come up in report? 23 Kerfeld and Scott, PLoS Biology 2011