Download
1 / 1
10 likes | 136 Vues
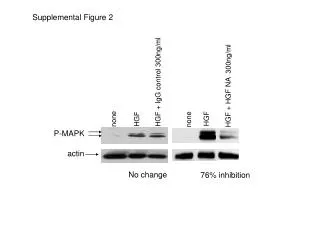
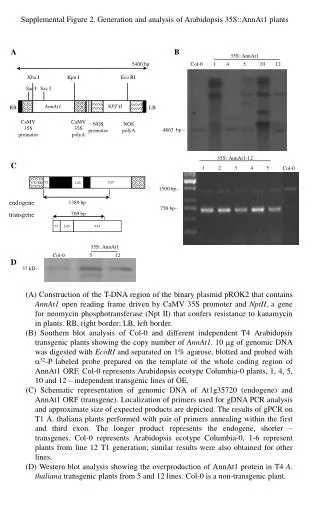
B. 35S::AnnAt1. A. Col-0. 1. 4. 5. 10. 12. 5400 bp. Xba I. Kpn I. Eco RI. Sac I. Sac I. NPT II. AnnAt1. RB. LB. 4863 b p –. CaMV 35S promotor. CaMV 35S polyA. NOS promotor. NOS polyA. 145. 737. 5’UTR. 75. 1. 2. 3. 4. 5. Col-0. endogene. 1389 bp.

E N D
B 35S::AnnAt1 A Col-0 1 4 5 10 12 5400 bp Xba I Kpn I Eco RI Sac I Sac I NPT II AnnAt1 RB LB 4863 bp – CaMV 35S promotor CaMV 35S polyA NOS promotor NOS polyA 145 737 5’UTR 75 1 2 3 4 5 Col-0 endogene 1389 bp transgene 709 bp 1500 bp– 35S::AnnAt1 750 bp– Col-0 5 12 D 37 kD – 75 145 737 Supplemental Figure 2. Generation and analysis of Arabidopsis 35S::AnnAt1 plants 35S::AnnAt1-12 C 3’UTR (A) Construction of the T-DNA region of the binary plasmid pROK2 that contains AnnAt1 open reading frame driven by CaMV 35S promoter and NptII, a gene for neomycin phosphotransferase (Npt II) that confers resistance to kanamycin in plants. RB, right border; LB, left border. (B) Southern blot analysis of Col-0 and different independent T4 Arabidopsistransgenic plants showing the copy number of AnnAt1. 10 mg of genomic DNAwas digested with EcoRI and separated on 1% agarose, blotted and probed with a32-P labeled probe prepared on the template of the whole coding region of AnnAt1 ORF. Col-0 represents Arabidopsisecotype Columbia-0 plants, 1, 4, 5, 10 and 12 – independent transgenic lines of OE. (C) Schematic representation of genomic DNA of At1g35720 (endogene) and AnnAt1 ORF (transgene). Localization of primers used for gDNA PCR analysis and approximate size of expected products are depicted.The results of gPCR on T1 A. thalianaplants performed with pair of primers annealing within the first and third exon. The longer product represents the endogene, shorter – transgenes. Col-0 represents Arabidopsisecotype Columbia-0, 1-6 represent plants from line 12 T1 generation; similar results were also obtained for other lines. (D) Western blot analysis showing the overproduction of AnnAt1 protein in T4 A. thaliana transgenic plants from 5 and 12 lines. Col-0 is a non-transgenic plant.