Download
1 / 87
890 likes | 1.13k Vues
CHAPTERS 10, 14, 15 Concentration, Monopolistic Competition, and Oligopoly. Varieties of Market Structure. We have studied the two extremes of market structure — perfect competition and monopoly. Most industries fall somewhere between those two, differing along two significant scales:

E N D
CHAPTERS10, 14, 15Concentration, Monopolistic Competition, and Oligopoly
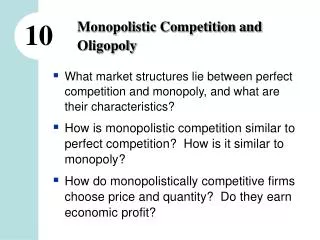
Varieties of Market Structure • We have studied the two extremes of market structure — perfect competition and monopoly. • Most industries fall somewhere between those two, differing along two significant scales: • Number of suppliers of output • The degree of product differentiation
Monopolistic Competition • Monopolistic competition is a market structure in which a large number of firms compete with each other by making similar but slightly different products. • Making a product slightly different from the product of a competing firm is called product differentiation.
Oligopoly • Oligopoly is a market structure in which a small number of producers compete with each other. • Some oligopolies (aluminum can manufacturing) produce identical products. • Others (automobiles) produce differentiated products.
Measures of Concentration • Industries in which only a few firms supply all the output are said to be concentrated. • Economists have developed two measures of concentration: • The four-firm concentration ratio • The Herfindahl-Hirschman Index
The Four-Firm Concentration Ratio • The four-firm concentration ratio is the percentage of total industry sales (in dollars) made by the four largest firms. • The range of this measure is from 0 to 100. • 0 is perfect competition • 100 means there are four or fewer firms in the industry • Ratio < 60 considered competitive
Concentration Ratio Calculations Smartphone OS Market Share Percentage of Industry Sales Firm 2009 2010 2011 Jan 2012 RIM Blackberry 37% 27% 23% 6% Apple iPhone 21% 28% 26% 43% Microsoft Windows Mobile 27% 14% 9% 2% Android 1% 23% 36% 47% Palm 8% 2% 1% 0% Linux 3% 3% 3% 1% Symbian 3% 3% 2% 1% Top 4 sales 85% 92% 94% 98% Other firms 15% 8% 6% 2%
Concentration Ratio Calculations PCs (2nd Q 2009, 2011, 2012) Market Share Firm 2009 2011 2012 HP 25.0% 27.0% 25.0% Dell 25.5% 22.6% 21.7% Apple 9.0% 10.8% 12.0% Acer 12.1% 9.3% 8.5% Toshiba 8.1% 9.6% 8.2% Others 20.3% 20.7% 24.6% Top 4 71.6% 69.7% 67.2%
Concentration Ratio Calculations Printers Sales Firm (millions of dollars) Fran’s 2.5 Ned’s 2.0 Tom’s 1.8 Jill’s 1.7 Top 4 sales 8.0 Other 1,000 firm’s sales 1,592.0 Industry sales 1,600.0 Four-firm concentration ratios: Printers: 8/1,600 100 = 0.5%
The Herfindahl-Hirschman Index (HHI) • The Herfindahl-Hirschman Index (HHI) is the sum of the squared market shares of the largest 50 firms in an industry. • For example, if there are four firms in an industry with market shares of 50%, 25%, 15%, and 10%, the HHI is: 502+252+152+102 = 3,450
Using the HHI • A monopoly will have an HHI of 10,000 (1002). • The Justice Department defines a competitive market as one with an HHI less than 1,000 (<100 is regarded as highly competitive). • Markets with HHI values between 1,000 and 1,800 are regarded as moderately competitive. • Markets with HHI values above 1,800 are regarded as uncompetitive. • The Federal Trade Commission (FTC) uses the HHI to evaluate potential mergers. • If the original HHI is between 1,000 and 1,800, any merger that raises the HHI by 100 or more is challenged. • If the original HHI is greater than 1,800, any merger that raises the HHI by more than 50 is challenged.
Antitrust Law • Antitrust law provides an alternative way in which the government may influence the marketplace. • Antitrust law is the law that regulates oligopolies and prevents them from becoming monopolies or behaving like monopolies. • The Antitrust Laws • The two main antitrust laws are • The Sherman Act, 1890 • The Clayton Act, 1914
Antitrust Law • The Sherman Act outlawed any “combination, trust, or conspiracy that restricts interstate trade,” and prohibited the “attempt to monopolize.”
Antitrust Law • A wave of merger activities at the beginning of the 20th century produced a stronger antitrust law, the Clayton Act, and created the Federal Trade Commission. • The Clayton Act made illegal specific business practices such as price discrimination, interlocking directorships, and acquisition of a competitor’s shares if the practices “substantially lessen competition or create monopoly.”
Antitrust Law • Table 15.6 (next slide) summarizes the Clayton Act and its amendments, the Robinson-Patman Act passed in 1936 and the Cellar-Kefauver Act passed in 1950. • The Federal Trade Commission, formed in 1914, looks for cases of “unfair methods of competition and unfair or deceptive business practices.”
Antitrust Law • Price Fixing Always Illegal • Price fixing is always a violation of the antitrust law. • If the Justice Department can prove the existence of price fixing, there is no defense.
Antitrust Law • Three Antitrust Policy Debates • But some practices are more controversial and generate debate. Three of them are • Resale price maintenance • Tying arrangements • Predatory pricing
Antitrust Law • Resale Price Maintenance • Most manufacturers sell their product to the final consumer through a wholesale and retail distribution chain. • Resale price maintenance occurs when a manufacturer agrees with a distributor on the price at which the product will be resold. • Resale price maintenance is inefficient if it promotes monopoly pricing. • But resale price maintenance can be efficient if it provides retailers with an incentive to provide an efficient level of retail service in selling a product.
Antitrust Law • Tying Arrangements • A tying arrangement is an agreement to sell one product only if the buyer agrees to buy another different product as well. • Some people argue that by tying, a firm can make a larger profit. • Where buyers have a differing willingness to pay for the separate items, a firm can price discriminate and take a larger amount of the consumer surplus by tying.
Antitrust Law • Predatory Pricing • Predatory pricing is setting a low price to drive competitors out of business with the intention of then setting the monopoly price. • Economists are skeptical that predatory pricing actually occurs. • A high, certain, and immediate loss is a poor exchange for a temporary, uncertain, and future gain. • No case of predatory pricing has been definitively found.
Antitrust Law • Mergers and Acquisitions • The Federal Trade Commission (FTC) uses guidelines to determine which mergers to examine and possibly block. • The Herfindahl-Hirschman index (HHI) is one of those guidelines. • As indicated earlier • If the original HHI is between 1,000 and 1,800, any merger that raises the HHI by 100 or more is challenged. • If the original HHI is greater than 1,800, any merger that raises the HHI by more than 50 is challenged.
Historical Example of Using the HHI to Evaluate MergersCarbonated Soft Drink Merger Proposals in 1986 Market Share Firm No Mergers Pepsi/7-Up Coke/Dr. Pepper Both Mergers Coca Cola 39% 39%46%46% Pepsi Cola28%34%28%34% Dr. Pepper 7% 7% - - 7-Up 6% - 6% - RJR 5% 5% 5% 5% Others (assume 15 15%15%15%15% equal share firms) HHI 2,4302,7662,9763,312
Limitations of Concentration Measures • There are three main reasons why concentration ratios may be misleading as measures of market structure: • The geographical scope of the market • Barriers to entry and firm turnover • The correspondence between a market and an industry
Geographical Scopeof Market • Concentration ratio calculations are based on national market data. • Some goods (such as newspapers) are sold in regional markets. • Other goods and services (automobiles) are sold in global markets. • In either case, concentration ratios are misleading.
Limitations of Concentration Measures • Market and Industry • Markets are narrower than industries • Firms make many different products • Firms switch from one market to another
Market and Industry • Concentration ratios are calculated using the Standard Industrial Classification (SIC) codes of the U.S. Department of Commerce. • Markets often do not correspond neatly to industries. • Westinghouse is classified as an electrical goods and equipment producer. They actually produce many other non-electrical items.
Barriers to Entryand Turnover • Measures of concentration do not tell us anything about the extent and severity of barriers to entry in an industry. • Even in markets that are highly concentrated, there may be competition if entry and exit cause a large amount of turnover.
Concentration Measures for the U.S. Economy • Motor vehicles, light bulbs, household laundry equipment, chewing gum, and breakfast cereals are highly concentrated oligopolies. • Pet food, computers, and soft drinks, are moderately competitive • Women’s clothing, ice cream, concrete blocks and bricks, and commercial printing are highly competitive.
Market Structures in the U.S. Economy • Between 1939 and 1980, the U.S. economy became increasingly competitive. • In 1980, three-fourths of the value of goods and services produced in the U.S. was sold in markets that are highly competitive. • Monopolies accounted for only about 5% of total sales. • Since 1980, there has been even more competition (due to global trading), but there have also been many mergers of oligopolies leading to greater concentration in certain oligopolistic industries (such as telecommunications)
Monopolistic Competition • Monopolistic competition is a market with the following characteristics: • A large number of firms. • Each firm produces a differentiated product. • Firms compete on product quality, price, and marketing. • Firms are free to enter and exit the industry.
Monopolistic Competition • Large Number of Firms • The presence of a large number of firms in the market implies: • Each firm has only a small market share and therefore has limited market power to influence the price of its product. • Each firm is sensitive to the average market price, but no firm pays attention to the actions of the other, and no one firm’s actions directly affect the actions of other firms. • Collusion, or conspiring to fix prices, is impossible.
Monopolistic Competition • Product Differentiation • Firms in monopolistic competition practice product differentiation, which means that each firm makes a product that is slightly different from the products of competing firms.
Monopolistic Competition • Competing on Quality, Price, and Marketing • Product differentiation enables firms to compete in three areas: quality, price, and marketing. • Quality includes design, reliability, and service. • Because firms produce differentiated products, each firm has a downward-sloping demand curve for its own product. • But there is a tradeoff between price and quality. • Differentiated products must be marketed using advertising and packaging.
Monopolistic Competition • Entry and Exit • There are no barriers to entry in monopolistic competition, so firms cannot earn an economic profit in the long run. • Examples of Monopolistic Competition • Figure 13.1 on the next slide shows market share of the largest four firms and the HHI for each of ten industries that operate in monopolistic competition.
Monopolistic Competition • The red bars refer to the 4 largest firms. • Green is the next 4. • Blue is the next 12. • The numbers are the HHI.
Output and Price in Monopolistic Competition • Short-Run Economic Profit • A firm that has decided the quality of its product and its marketing program produces the profit maximizing quantity at which its marginal revenue equals its marginal cost (MR = MC). • Price is determined from the demand curve for the firm’s product and is the highest price the firm can charge for the profit-maximizing quantity.
Output and Price in Monopolistic Competition • Figure 13.2(a) shows a short-run equilibrium for a firm in monopolistic competition. • It operates much like a single-price monopolist.
Output and Price in Monopolistic Competition • The firm produces the quantity at which price equals marginal cost and sells that quantity for the highest possible price. • It earns an economic profit (as in this example) when P > ATC.
Output and Price in Monopolistic Competition • Long Run: Zero Economic Profit • In the long run, economic profit induces entry. • And entry continues as long as firms in the industry earn an economic profit—as long as (P > ATC). • In the long run, a firm in monopolistic competition maximizes its profit by producing the quantity at which its marginal revenue equals its marginal cost, MR = MC.
Output and Price in Monopolistic Competition • As firms enter the industry, each existing firm loses some of its market share. The demand for its product decreases and the demand curve for its product shifts leftward. • The decrease in demand decreases the quantity at which MR = MC and lowers the maximum price that the firm can charge to sell this quantity. • Price and quantity fall with firm entry until P = ATC and firms earn zero economic profit.
Output and Price in Monopolistic Competition • This figure shows a firm in monopolistic competition moving from short-run equilibrium to long-run equilibrium. • If firms incur an economic loss, firms exit to restore the long-run equilibrium just described.
Output and Price in Monopolistic Competition • Monopolistic Competition and Efficiency • Firms in monopolistic competition are inefficient and operate with excess capacity. • Figure 13.3 on the next slide illustrates these propositions.
Output and Price in Monopolistic Competition • Because they product- differentiate and face a downward-sloping demand curve for their products, firms in monopolistic competition receive a marginal revenue that is less than price for all levels of output.
Output and Price in Monopolistic Competition • Firms maximize profit by setting marginal revenue equal to marginal cost, so with marginal revenue less than price, marginal cost is also less than price.
Output and Price in Monopolistic Competition • Because price equals the marginal benefit, marginal cost is less than marginal benefit. • Underproduction in monopolistic competition creates deadweight loss.