EET 2259 Unit 2 Virtual Instruments
EET 2259 Unit 2 Virtual Instruments. Read Bishop, Chapter 2. Lab #2 and Homework #2 due next week. Quiz #1 next week. Virtual Instruments. Remember, LabVIEW programs are called virtual instruments , or VI s for short.

EET 2259 Unit 2 Virtual Instruments
E N D
Presentation Transcript
EET2259 Unit 2Virtual Instruments • Read Bishop, Chapter 2. • Lab #2 and Homework #2 due next week. • Quiz #1 next week.
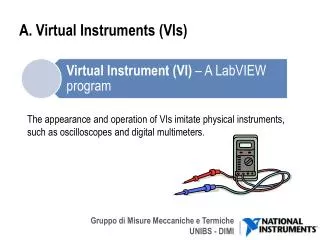
Virtual Instruments • Remember, LabVIEW programs are called virtual instruments, or VIs for short. • Recall that every VI has a front panel (user interface) and a block diagram (program code). (Bishop, p. 53)
Items on Front Panel • The front panel contains controls and indicators. • Controls are inputs that let the user enter data, such as switches, knobs. • Indicators are outputs that display data to the user, such as graphs, numeric displays. (Bishop, p. 62)
Controls Palette • Use the controls palette to place controls or indicators on the front panel. (Open palette by View > Controls Palette or by right-clicking a blank area on front panel.) (Bishop, p. 62)
Finding Controls & Indicators • On the controls palette, under Modern, the most commonly used controls and indicators are grouped into three categories: Numeric, Boolean, and String & Path.
Search Button on Controls Palette • Search button lets you find controls or indicators by name. (Bishop, p. 64) Search
Items on Block Diagram • The block diagram contains items connected by wires. Most items on the block diagram fall into one of four categories: • Terminals representing front-panel controls or indicators, or constant values. • Built-in functions (such as multiplication) • SubVIs (A subVI is a smaller program contained within a bigger program.) • Express VIs (a special type of subVI) (Bishop, pp. 68-69)
Distinguishing Functions from SubVIs (Part 1) • On block diagrams, built-in functions have a pale yellow background, while subVIs usually have a white background (except for Express VIs, which have a blue background). (Bishop, p. 70)
Distinguishing Functions from SubVIs (Part 2) • When you double-click a function, nothing happens. • When you double-click a standard subVI, the front panel for the subVI opens. (Remember, a subVI is a complete program with its own front panel and block diagram.) • When you double-click an Express VI, a dialog box opens to let you configure it. (Bishop, p. 70)
Functions, SubVIs, and Express VIs • Functions: Can’t be customized. • Standard subVIs: You can rewire the block diagram to customize. • Express VIs: You use dialog box to customize.
Icons vs. Expandable Nodes • Standard subVIs and Express VIs can be displayed either as icons or as expandable nodes. • To change display, right-click and select (or deselect) “View As Icon.” (Bishop, p. 70)
Example • Same VI, viewed three different ways. Icon Expandable Node Expanded Node
Colors for Data Types • Terminals and wires are color-coded to show what type of data they carry: • Blue = integer • Orange = floating point number • Green = Boolean (true/false) • Pink = String (text) • Blue & White Dashed = Dynamic (for Express VIs) • Usually two terminals can be connected together by a wire only if they’re the same data type. (Bishop, p. 72)
Terminals • A terminal on a block diagram is a connection point for a wire. There are several kinds of terminals, including: • Constants • Control terminals for inputs from front panel • Indicator terminals for outputs to front panel • Node terminals on functions or subVIs (Bishop, p. 71)
Control Terminals • A control terminal has an arrow pointing out to the right. • There’s a control terminal on the block diagram for each control on the front panel. • On front panel, can right-click and choose “Find Terminal.” • On block diagram, can right-click and choose “Find Control.” (Bishop, p. 72)
Indicator Terminals • An indicator terminal has an arrow pointing in from the left. • There’s an indicator terminal on the block diagram for each indicator on the front panel. • On front panel, can right-click and choose “Find Terminal.” • On block diagram, can right-click and choose “Find Indicator.” (Bishop, p. 72)
Icons vs. Data Type Terminals • On the block diagram, control terminals and indicator terminals can be displayed either as icons or as data type terminals. • To change display, right-click and select (or deselect) “View As Icon.” (Bishop, p. 72) Icon Data Type Terminal
Terminals on Functions or SubVIs (Part 1) • Functions and subVIs also have terminals where wires can connect to them. • By convention, inputs are placed on the left and outputs are on the right.
Terminals on Functions or SubVIs (Part 2) • To show terminals more clearly, right-click and select “Visible Items” > “Terminals”
Dataflow Programming • In traditional text-based programming languages, the order of the statements determines the order in which they’re executed. • In LabVIEW’s graphical language, the layout on the page does not tell you the order of execution. A node executes whenever all of its inputs are available. (Bishop, pp. 82-83)
Highlight Execution Button • To watch the order in which nodes are executed in the block diagram, click the Highlight Execution button on block diagram’s toolbar and then run the VI. (Bishop, p. 84) Click on Highlight Executionbutton; data flow is animated using bubbles. Values are displayed on wires.