Statistical Anomalies Analysis: Insights on Control Limits and Findings
This report, authored by Aloysius, Chan, Eddie, Lim, Tan, Yu, Xiang, Yap, Jun, Lin, Lee, and Bing Qian, delves into the analysis of anomalies in data patterns above and below control limits. It discusses various parameters (1-19), identifies trends in fluctuation frequencies, and offers recommendations for tightening control limits. The findings emphasize the significance of understanding each parameter and recommend deeper exploration into statistical analysis and charting methods to enhance data comprehension and insight.


Statistical Anomalies Analysis: Insights on Control Limits and Findings
E N D
Presentation Transcript
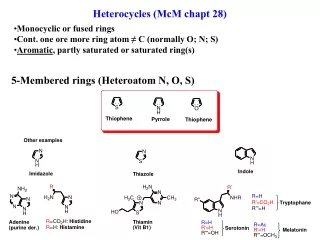
MCM Data Report Aloysius Chan Eddie Lim Tan Yu Xiang Yap Jun Lin Lee Bing Qian
Anomaly above Findings - Parameters 1, 2, 3 Upper Control Limit Centre Line
Findings - Parameters 12, 13, 14 Upper Control Limit Centre Line Lower Control Limit
Anomaly frequency increases Findings - Parameters 15, 16, 17, 18 Centre Line Upper Control Limit Lower Control Limit
Findings - Parameter 19 Centre Line Fluctuation Upper Control Limit Lower Control Limit
15 16 17 18 19 15 16 17 18 Anomalies Anomaly frequency increase 4000 onwards
Anomalies 15 16 17 18 19 Run above centre line Run below centre line
Anomalies 15 16 17 18 19 Fluctuation
Recommendations Anomalies greatly skew moving range Tighten control limits Most points lie near to the centre line
Final Thoughts Explore topic deeper Deeper exploration of statistical analysis Different types of charts Better understanding of data Meaning of each individual parameter Significance of findings