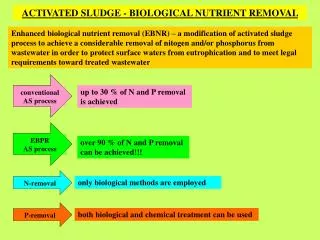
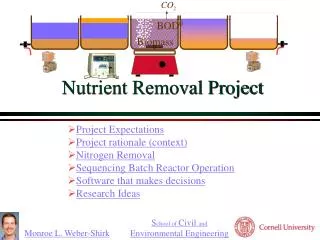
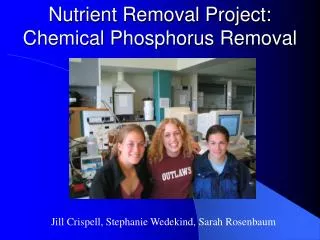
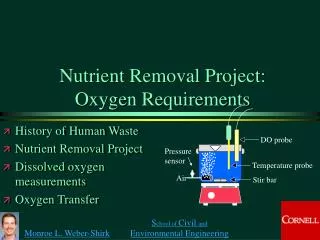
Optimizing Biological Nutrient Removal Processes
Optimizing Biological Nutrient Removal Processes. 유창규 경희대학교 환경응용화학대학 환경관리시스템공학연구실 (EMSEL). 환경관리공단 (2007 년 3 월 9 일 ). Presentation. Review of Theory Nitrification Denitrification Phosphorus Removal Optimization for nutrient removal Nitrification Optimization


Optimizing Biological Nutrient Removal Processes
E N D
Presentation Transcript
Optimizing Biological Nutrient Removal Processes 유창규 경희대학교 환경응용화학대학 환경관리시스템공학연구실(EMSEL) 환경관리공단 (2007년 3월 9일)
Presentation • Review of Theory • Nitrification • Denitrification • Phosphorus Removal • Optimization for nutrient removal • Nitrification Optimization • Denitrification Optimization • Systematic optimization protocol for N and P removal • Case study 1 : SBR, Belgium • Case study 2 : Haaren, carrousel, Netherlands • Problems and Troubleshooting (?)
References • Jeanette A. Brown, P.E., DEE, (Executive Director SWPCA, CSWEA)- Optimizing Biological Nitrogen Removal Processes, USA • Dean Pond, Black & Veatch (WWTP Operators School)- Biological Wastewater Treatment Operators School, USA • Kim J.K, University of Wisconsin Madison, Biological Nutrient Removal Theories and Design, USA • Tao Jiang, BIOMATH , Belgium, UNESCO-IHE, Calibrating a Side-stream Membrane Bioreactor using ASM1, Belgium • Henze, DTU, Activated Sludge Model 1,2,2d,3, Denmark • Peter A. Vanrolleghem, Laval Univ., Optimal but robust N and P removal in SBRs,Canada
Advanced Treatment Systems What are the effects of N and P in receiving waters?
What are the effects of N and P in receiving waters? • Increases aquatic growth (algae) • Increases DO depletion • Causes NH4 toxicity • Causes pH changes
Nitrogen Removal • Purpose • Reduce effluent N (ammonia and nitrates) • Biological or chemical • Reduce nutrient load on stream • Reduce algae growth • Reduce oxygen depletion
Why is it necessary to treatthe forms of nitrogen? • Improve receiving stream quality • Increase chlorination efficiency • Minimize pH changes in plant • Increase suitability for reuse • Prevent NH4 toxicity • Protect groundwater from nitrate contamination
What are the forms of nitrogen found in wastewater? • TKN = 40% Organic + 60% Free Ammonia Typical concentrations: Ammonia-N = 10-50 mg/L Organic N = 10 – 35 mg/L • No nitrites or nitrates • Forms of nitrogen: Organic N Ammonia Nitrite Nitrate TKN Total N
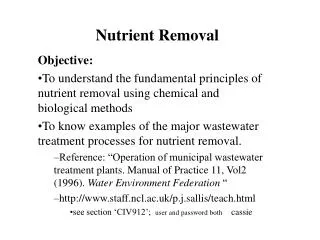
Why is it sometimes necessary to remove P from municipal WWTPs? • Reduce phosphorus, which is a key limiting nutrient in the environment • Improve receiving water quality by: • Reducing aquatic plant growth and DO depletion • Preventing aquatic organism kill • Reduce taste and odor problems in downstream drinking water supplies
Advanced Treatment Systems Identify and explain the objectives of the following advanced treatment systems: • Further removal of organics • Further removal of suspended solids • Nutrient removal (N and P) • Removal of dissolved solids
Advanced Treatment Systems How is N removed or altered by conventional secondary (biological) treatment?
Nitrification • Oxidation of ammonia nitrogen to nitrite nitrogen by nitrosamonas group: • NH4+ + O2 2H+ + NO2- • Oxidation of nitrite nitrogen by nitrobacter group: • NO2- + O2 NO3-
Nitrification • NH4+ Nitrosomonas NO2- • NO2- Nitrobacter NO3- • Notes: • Aerobic process • Control by SRT (4 + days) • Uses oxygen 1 mg of NH4+ uses 4.6 mg O2 • Depletes alkalinity 1 mg NH4+ consumes 7.14 mg alkalinity • Low oxygen and temperature = difficult to operate
Un-aerated Bioreactor (Anoxic Zone) Nitrate Recycle Primary Effluent Anoxic Aerobic RAS WAS
Characteristics of an Un-aerated Bioreactor • Anoxic • Microorganisms • Facultative heterotrophic-use carbon for the formation of new biomass • Use nitrate/nitrite instead of oxygen • Oxygen is preferred
Nitrification No Nitrification Nitrifier Minimum Aerobic SRT Varies with Temperature.
Effective Nitrification • Achieved by: • Effective nitrification • Adequate Aerobic SRT • Temperature • Sufficient Oxygen Transfer Capacity • Maintain a DO of 2 mg/l at peak loadings • pH > 6.5, preferably >7 • Accomplished by sufficient alkalinity (Effluent concentration at least 50 mg/l • No inhibitory materials
Nitrification Optimization Summary • Test nitrification rate occasionally • Select appropriate SRT • Keep DO at 2 mg/l • Keep pH about neutral (optimal 7.5 to 8.5) • Provide sufficient alkalinity
Denitrification • Using methanol as carbon source: 6 NO3- + 5 CH3OH N2 + 5 CO2 + 7 H2O + 6 OH- • Using an endogenous carbon source: C5H7NO2 + 4.6 NO3- 2.8 N2 + 5 CO2 + 1.2 H2O + 4.6 OH-
Denitrification • NO3- denitrifiers (facultative bacteria) N2 gas + CO2 gas • Notes: • Anoxic process • Control by volume and oxic MLSS recycle to anoxic zone • N used as O2 source = 1 mg NO3- yields 2.85 mg O2 equivalent • Adds alkalinity 1 mg NO3- restores 3.57 mg alkalinity • High BOD and NO3- load and low temperature = difficult to operate
Denitrification with Supplemental Carbon Methanol or other carbon source Primary Effluent Nitrate Recycle Anoxic Aerobic Aerobic Anoxic RAS WAS
% Denit = R/(R+Q) * 100 Denitrification is Controlled by Mixed Liquor Recirculation.
Effective Denitrification • Size based on anoxic SRT • Typically 1 to 2 days depending on temperature • Effective Denitrification • Sufficient Anoxic Volume (Anoxic SRT) • Sufficient Carbon • Sufficient mixed liquor recirculation
External Carbon • Methanol • Stoichiometry • 2.5 (NO3-N) + 1.5 (NO2-N) + 0.87 (DO) • Or, approximately 3 mg CH3OH/mg NO3-N • Requires 1 to 3 day SRT in secondary anoxic zone depending on temperature • Other carbon sources technically feasible but generally more expensive.
Denitrification Optimization Summary • Minimize DO in anoxic zone (< 0.2 mg/l) • Have 2Q to 4 Q recycle capabilities • Provide sufficient carbon (readily biodegradable COD) • Maximize use of secondary anoxic zones
Phosphorus Removal • Purpose • Reduce effluent P • Biological or chemical method • Reduce nutrient load on stream • Reduce algae growth • Reduce oxygen depletion • Application / Mechanism • Biological • Chemical
Phosphorus Removing Mechanism Energy Facultative bacteria Acinetobacter spp. Acetate plus fermentation products Substrate (Phosphorus removing bacteria, slow grower) Poly-P PHB Anaerobic Aerobic Energy PHB + Poly-P New biomass
Continued … Q Anaerobic Zone Aerobic Zone Final Clarifier Effl P Release P Luxury Uptake RAS WAS P Removal Phosphorus Removal • Biological
Continued … Phosphorus Removal • Chemical Primary Clarifier Aerobic Zone Effl Final Clarifier Q Chemical Coagulant Chemical Coagulant RAS WAS P Removal
Effective Phosphorus Removal • Size based on SRT • Typically 7 to 10 days depending on temperature • Effective Denitrification • Sufficient Anaerobic Volume (Anaerobic SRT) • Sufficient influent carbon • Competition between denitrification and phosphorous removal bacteria • Sensitive to influent carbon • Unstable process
Guidelines for Biological Nutrient Removal (BNR) Process Selection Nitrogen Removal • Four Stage Bardenpho Process • Modified Ludzack-Ettinger (MLE) Process Phosphorus Removal Only • A/O Process Nitrogen and Phosphorus Removal • Five Stage Bardenpho (Phoredox) Process • University of Cape Town (UCT) Process • Modified UCT Process • Virginia Initiate Process (VIP)
Schematic Process Configurationfor Optional Operations Mixed liquor recycle, r Mixed liquor recycle, a Secondary clarifier Anoxic Anaerobic Aerobic Influent Effluent Sludge recycle, s Phoredox process UCT process Modified UCT process
Process Selection Based on TKN/COD ratio (Initial Screening) Nitrogen Removal • TKN/COD < 0.09: Bardenpho process • TKN/COD > 0.10: MLE process Nitrogen and/or Phosphorus Removal • TKN/COD < 0.07 ~ 0.08: A/O, A2/O, Phoredox process (modified Bardenpho) • TKN/COD < 0.12 ~ 0.14: UCT process • TKN/COD < 0.11: Modified UCT process
Introduction • WWTP are complex systems • Complex models can help in: • Understanding the processes • Plant design • Plant optimisation • Plant control • In practice • Which model to choose? • How to calibrate the model? • How to optimize the process need for calibration and optimization protocol
Systemunder study OptimizedSystem Experimenting Reality Modelling Implement Virtual Reality Simulate Model of the System Solution for the System Why Model-based Optimization ? Solving Problems for wwtp systems
The systematic optimisation protocol 1.Objective(s) 2.Framework of the optimization 3. Model selection and calibration 4. Scenario analysis 5. Evaluation of the results of scenarios 6. Implementation of the best scenario 7. Measurement campaign No Target reached? Yes END • Systematize and standardize the model-based optimisation using mechanistic models (ASM2d for N- & P- removal) • Objective oriented & iterative protocol • A grid of scenarios (full-factorial design) built on the basis of the degrees of freedom and the constraints of the SBR system • Selection and calibration of a suitable model to describe the biological processes • Simulation and evaluation of a multitude of scenarios • Selection of the best scenario • Implementation & final evaluation
Necessary information for model calibration Plant Information Mass balance, Operating parameters (SRT, HRT, control) Aeration & Hydraulics Model based w.w. characterization Flowrates COD fractionation (SS, SF, XS, XI, SI) N, P fractions, TSS Biomass characterization Kinetic, stoichiometric parameters Active biomass fractions Biomass composition
Biomath calibration protocolStage II – Plant survey/data analysis • Design data • Plant layout/configuration, volumes, pumps, aerators,... • Operational data • Flow rates, sludge recycle/waste, control strategies,... • Measured data • Influent/effluent characterisation (COD,TKN,PO4,NO3,...) • On-line measurements (DO,T,pH,...) • TSS (RAS and effluent), sludge age/production,... • Mass balances • Flow rate, sludge (including N & P) • Important for data quality check (e.g. sludge age)
Anaerobic + filling Anoxic Aerobic Draw Aerobic Settling Influent NO3- Effluent Concentration PO43- 60 150 60 30 45 15 Cycle time (min) Case study (I) - SBR • Developing a robust biological system • Detect the major sources of process disturbances as soon as possible • Useful to keep the sludge as stable as possible • Volume (80 L), SRT (10 d) and HRT (12 h), 6 hour cycle mode • Six on-line measurements (DO, ORP, pH, conductivity, temperature, weight)
Introduction • Both N & P removal successfully demonstrated at lab-scale and full-scale SBR installations. • SBR offers more flexibility in operation (compared to continuous systems) –a key aspect in process optimisation. • A myriad of operating strategies to optimise nutrient removal performance in SBRs. • Usually developed at lab- or pilot-scale & only comparison of a few operating scenarios • Increasingly, mathematical models(e.g. ASM1 for N-removal and ASM2d for N- & P- removal) are used to search for theoptimal operating scenario
Model selection and calibration ASM2d extended with hydrolysis of organic nitrogen module of ASM1 model was selected and calibrated for the SBR system.
Scenario analysis • Construction of grids of scenarios • Choose a range and interval for the degrees of freedoms: SO-sp: [0.2, 0.4, 0.6, 0.8, 1,2] Vstep-feed: [0, 5, 10] TANB: [60, 70, 80] TAER: [130, 140, 150] Intermittent aeration frequency:[1, 2, 4, 8] Full-factorial design of degrees of freedoms: total 648 scenarios • Each scenario simulated for 30 days (3 X SRT)
Scenario analysis reference Scenario analysis • Formulation of grids of scenarios: Configuration of intermittent aeration frequencies & step-feed of influent () IAF1 IAF2 IAF4 IAF8
Evaluation of the scenarios • Effluent quality Effluent quality of 648 scenarios were analysed, general conclusions: • Increasing TANB improves P-removal but decreases N-removal • Increasing TAER slightly improves the nitrification but negative effect on denitrification. • The SO-sp is the most critical/dictates the overall behaviour of the system. • The step-feed has a positive effect on the denitrification. • Increasing the intermittent aeration frequency (IAF) increases N & P removal
Evaluation of the advanced Nutrient Removal • Simulation of N and P trends in the best scenario (BSC) • Off-line effluent results of N and Pin SBR • Effective for N-removal but ? for P-removal and need for settling Integrated monitoring of microbial community dynamics