Download
1 / 25
740 likes | 2.12k Vues
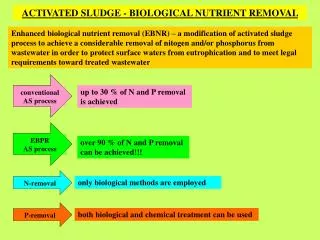
conventional AS process. EBPR AS process. N-removal. P-removal. ACTIVATED SLUDGE - BIOLOGICAL NUTRIENT REMOVAL.

E N D
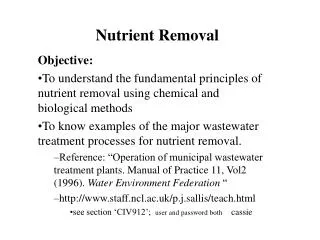
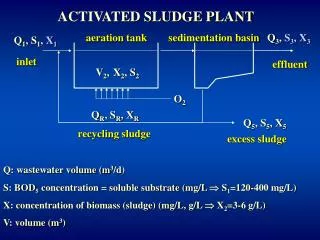
conventional AS process EBPR AS process N-removal P-removal ACTIVATED SLUDGE - BIOLOGICAL NUTRIENT REMOVAL Enhanced biological nutrient removal (EBNR) – a modification of activated sludge process to achieve a considerable removal of nitogen and/or phosphorus from wastewater in order to protect surface waters from eutrophication and to meet legal requirements toward treated wastewater up to 30 % of N and P removal is achieved over 90 % of N and P removal can be achieved!!! only biological methods are employed both biological and chemical treatment can be used
EUTROPHICATION Natural process (accelerated by human activities) by which a lake gradually becomes enriched in plant nutrients (mainly N and P) as a result of natural erosion and runoff from the surrounding land basins. This leads to algal blooms, excessive growth of macrophytes in the littoral, decreased visibility,oxygen depletion, and adverse changes in in the species compostion. Stages of eutrophication: • Water enrichment in nutrients from natural and antropogenic sources (including wastewater discharge and atmospheric precipitation). • Rapid growth of algae and rooted plants, particularly in the summer. • Algae atrophy, release of organic substances and toxins leading to the growth of aerobic bacteria and dissolved oxygen depletion. • Gradual atrophy of fish and most other organisms due to oxygen starvation. These organisms are replaced with anaerobic bacteria which produce smelly decomposition products. Fig. Major sources of nutrient overload
BIOLOGICAL NITROGEN REMOVAL Biological nitrogen removal processes: • Ammonification • Nitrification • Denitrification • Assimilation (incorporation) Nitrosomonas sp. Nitrobacter sp.
Effect The biological nitrogen removal processes 1.AMMONIFICATION decomposition of organic polymers (proteins, aminoacids) into ammonium nitrogen in aerobic, anoxic and anerobic conditions ammonification in aerobic conditions: C10H19O3N + 12,5O2 10CO2 + 8H2O + NH3 or C10H19O3N + 12,5O2 9CO2 + 7H2O + NH4HCO3 an alkalinity increase (3,57 gCaCO3/gN) ammonification reactions: R–NH2 + H2O R–OH + NH3 R–CHNH2–COOH + H2O R–CO–COOH + 2H+ + NH3 R–CHNH2–COOH + 2H+ R–CH2–COOH + NH3 R–CH2–CHNH2–COOH R-CH=CH–COOH + NH3
by the action of by the action of ½ O2 O2 Nitrosomonas Nitrobacter nitrifiers The biological nitrogen removal processes 2.NITRIFICATION oxidation of ammonium nitrogen into nitrites and nitrates Nitrosomonas sp., Nitrosococcus sp., Nitrosolobus sp., Nitrosovibrio sp., Nitrospira sp., Nitrobacter sp., Nitrococcussp. autotrophic nitrification ammonia oxidation: NH4+ + 1.5O2 + 2HCO3– NO2– + 2H2CO3 + H2O nitrite oxidation: NO2– + 0.5O2 NO3– overall reaction: NH4+ + 2O2 + 2HCO3– NO3– + 2H2CO3 + H2O • 4.33 gO2 are utilized • 7.15 g of alkalinity (as CaCO3) are destroyed • 0.15 g of new cells are formed • 0.08 of inorganic carbon are consumed For 1 g NH3 oxidized to NO3–: Thiosphaera sp. (Paracoccus sp.), Arthrobacter sp., Flavobacterium sp. etc. heterotrophic nitrification R–NH2R–NHOH R–NO NO3–
Effect Effect The biological nitrogen removal processes 3.ASSIMILATION (incorporation) assimilation of nitrogen into cell material. ammonia assimilation: C6H12O6 + NH4+ + 2,79O2 0,49C5H7O2N + 0,13C6H12O6 + 0,51NH4+ + 2,79CO2 + 4,26H2O + 0,49H+ an alkalinity drop (3,57 gCaCO3/gN) nitrate assimilation: C6H12O6 + NO3– + 2,59O2 0,32C5H7O2N + 0,19C6H12O6 + 0,68NO3– + 3,23CO2 + 3,55H2O + 0,32OH– an alkalinity increase (3,57 gCaCO3/gN)
by the action of by ammonia oxidizers The biological nitrogen removal processes 4.DENITRIFICATION reduction of nitrates into gaseous nitrogen. heterotrophic denitrification Aerobacter sp., Arthrobacter sp., Clostridium sp., Bacillus sp., Escherichia sp., Flavobacterium sp., Nocardia sp., Pseudomonas sp. etc. denitrification reactions with methanol: First step: 6NO3– + 2CH3OH 6NO2– + 4H2O + 2CO2R– Second step: 6NO2– + 3CH3OH 3N2 + 3H2O + 3CO2 + 6OH– Overall reaction: 6NO3– + 5CH3OH 3N2 + 7H2O + 5CO2 + 6OH– • 3,7 g COD (2,8 g of methanol) are consumed. • 3,57 g of alkalinity (as CaCO3) are yielded. • 0,45 g of VSS are produced. For 1 g NO3– reduced to N2: Nitrosomonas sp., Nitrobacter sp. etc. autotrophic denitrification NH4+ + NO2– N2 + 2H2O aerobic heterotrophic denitrification simultaneous use of O2 and NO2– as terminal electron acceptors by e.g. Paracoccus sp.
Requirements for nitrification/denitrification in BNR plants *methanol, ethanol, VFAs, glucose, starch etc.
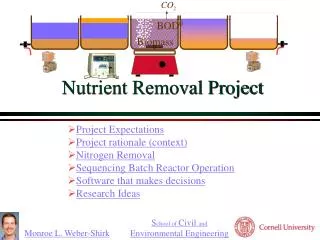
MECHANISMS OF BIOLOGICAL PHOSHORUS REMOVAL 1. Conventional P-uptake The use of phosphorus for anabolic processes 2. Increased phosphate uptake The use of phosphates in the shortage or absence of sulfur or nitrogen. The shortage or absence of S or N inhibits the biosynthesis of nucleic acids and the cell growth. In consequence polyphosphate kinases become active and the cell uptakes PO43- from the environment: ADP + PO43– ATP 3. Overplus compensation Enhanced P-accumulation after a periodic shortage of this nutrient in wastewater. 4. Luxury uptake increasing the activity of enzymes (of PAOs) responsibe for the increase of ATP/ADP ratio, through the polyphosphate decomposition. It needs alternate anaerobic/aerobic conditions and readily degradable carbon.
acetate respiration CO2 CO2 glycogen glycogen [H] H2O CO2 O2 organic matter acetyl – CoA maintenance energy ATP (energy) ATP PHB ADP poly-P ADP PO43 – PO43 – PO43 – poly-P growth PHB Principles of the EBPR process – luxury uptake phenomenon ANAEROBIC PHASE (no oxygen or nitrates present) AEROBIC PHASE (oxygen or nitrates present)
phosphate release phosphate uptake PO4 - concentration net elimination ANAEROBIC ZONE AEROBIC ZONE Principles of the EBPR process – luxury uptake phenomenon • EBPR requirements in AS systems: • strict anaerobic conditions in anaerobic zone (absence of oxygen, nitrites and nitrates), • presence of readily degradable organic compounds in anaerobic zone(BOD/P= 20-25), • SRT = 2 – 5 d (high BX), • HRT = 0.5 – 2.0 h in anaerobic zone. Fig. A/O (PHOREDOX) process
source: Wachtmeister A., Kuba T., Van Loosdrecht M.C.M., Heijnen, (1997). A sludge characterization assay for aerobic denitrifying phosphorus removing sludge, Water Research, vol. 31, no. 3, pp. 471-478.
The AS proces configurations for nitrogen removal Fig. Dual AS-processes for nitrogen removal.
– aerobic zone – anoxic zone Input Effluent WAS The AS proces configurations for nitrogen removal 1 2 3 4 Internal recycle RAS 1 – first anoxic zone (denitrification, phosphate release) 2 – first aerobic zone (BOD removal, nitrification, P-uptake) 3 – second anoxic zone (denitrification of residual nitrates) 4 – post aeration zone Fig. Conventional 4 – stage Bardenpho process.
Effluent Effluent Influent Internal recycle Internal recycle – aerobic zone – anoxic zone RAS – anaerobic zone WAS WAS Influent RAS The AS proces configurations for N and P removal Fig 1. Modified (5 – stage) Bardenpho process Fig 2.Three-stage Bardenpho process
Effluent Effluent Internal recycle – aerobic zone – anoxic zone – anaerobic zone WAS WAS Influent RAS Internal recycle RAS Influent The AS proces configurations for N and P removal Fig 3. A2/O process Fig 4.UCT process
Internal recycle II Internal recycle I Effluent Effluent Influent – aerobic zone – anoxic zone – anaerobic zone RAS WAS WAS Influent Internal recycle RAS The AS proces configurations for N and P removal Fig 5. Modified UCT (MUCT) process Fig 6.JHB process
Effluent – aerobic zone – anoxic zone – anaerobic zone WAS Internal recycle I Influent Int. rec. II RAS Effluent Influent Internal recycle RAS WAS The AS proces configurations for N and P removal Fig 7. Modified JHB (MJHB) process Fig 8. EASC (Extended Anaerobic Sludge Contact) process
Effluent Effluent VFA Influent – aerobic zone – anoxic zone – anaerobic zone WAS WAS RAS RAS Internal recycle VFA Influent Internal recycle The AS proces configurations for N and P removal Fig 9. Westbank & Kelowna process Fig 10. SAP process
– aerobic zone – anoxic zone – anaerobic zone Influent Effluent Internal recycle VFA RAS WAS The AS proces configurations for N and P removal Fig 11.STEPPE process
Activated sludge aerobic tank Influent Effluent RAS WAS Chemical precipitation Supernatant Stripper Lime dosage Chemical sludge WAS Combined chemical-biological P removal in AS system Fig 12.Phostrip process
Fig. SBR process configuration for N and P removal Fig. Oxidation ditch process configuration for N removal
source: Mino T., Van Loosdrecht M.C.M, Heijnen J.J., (1998). Microbiology and biochemistry of the enhanced biological phosphate removal process, Water Research, vol. 32, no. 11, pp.3193-3207.