Mastering Performance Analysis with Vampir: A Hands-On Guide for Parallel Applications
This comprehensive guide introduces the Vampir tool suite for visualizing and analyzing performance in complex parallel processes. It covers the mission of the tool, event trace visualization, and the benefits of using Vampir and VampirServer. The guide includes hands-on sessions for analyzing NPB-MZ-MPI benchmarks, showcasing visualizations such as timeline charts and summary statistics. Key questions that Vampir addresses, like identifying computation imbalances and communication patterns, are explored. Gain insights into monitoring dynamic runtime behavior and optimizing application performance.

Mastering Performance Analysis with Vampir: A Hands-On Guide for Parallel Applications
E N D
Presentation Transcript
Performance Analysis with Vampir Bert Wesarg, Andreas Knüpfer ZIH, TechnischeUniversitätDresden
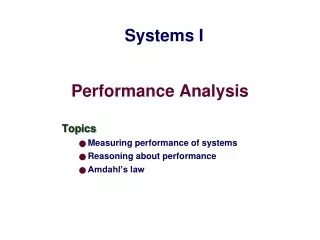
Outline Part I: Welcome to the Vampir Tool Suite • Mission • Event Trace Visualization • Vampir & VampirServer • The Vampir Displays Part II: Vampir Hands On • Visualizing and analyzing NPB-MZ-MPI / BT Part III: Summary and Conclusion
Mission • Visualization of dynamicsof complex parallel processes • Requires two components • Monitor/Collector (Score-P) • Charts/Browser (Vampir) Typicalquestionsthat Vampir helpstoanswer: • What happens in my application execution during a given time in a given process or thread? • How do the communication patterns of my application execute on a real system? • Are there any imbalances in computation, I/O or memory usage and how do they affect the parallel execution of my application?
Event Trace Visualization with Vampir • Alternative and supplement to automatic analysis • Show dynamic run-time behavior graphically at any level of detail • Provide statistics and performance metrics Timeline charts • Show application activities and communication along a time axis Summary charts • Provide quantitative results for the currently selected time interval
CPU CPU CPU CPU CPU CPU CPU CPU Multi-Core Program Trace File(OTF2) Vampir – Visualization Modes (1) • Directly on front end or local machine % vampir Score-P Vampir8 Small/Medium sized trace Thread parallel
CPU CPU CPU CPU CPU CPU CPU CPU CPU CPU CPU CPU CPU CPU CPU CPU CPU CPU CPU CPU CPU CPU CPU CPU CPU CPU CPU CPU CPU CPU CPU CPU CPU CPU CPU CPU CPU CPU CPU CPU CPU CPU CPU CPU CPU CPU CPU CPU Trace File (OTF2) VampirServer Many-Core Program Vampir – Visualization Modes (2) • On local machine with remote VampirServer % vampir % vampirserverstart –n 12 Vampir8 Score-P LAN/WAN Large Trace File (stays on remote machine) MPI parallel application
Usage order of the Vampir Performance Analysis Toolset • Instrument your application with Score-P • Run your application with an appropriate test set • Analyze your trace file with Vampir • Small trace files can be analyzed on your local workstation • Start your local Vampir • Load trace file from your local disk • Large trace files should be stored on the HPC file system • Start VampirServer on your HPC system • Start your local Vampir • Connect local Vampir with the VampirServer on the HPC system • Load trace file from the HPC file system
The maindisplaysof Vampir • Timeline Charts: • Master Timeline • Process Timeline • Counter Data Timeline • Performance Radar • Summary Charts: • Function Summary • Message Summary • Process Summary • Communication Matrix View
Vampirhands-on Visualizing and analyzing NPB-MZ-MPI / BT
Vampir: Visualizationofthe NPB-MZ-MPI / BT trace % vampirscorep_bt-mz_B_4x4_trace Navigation Toolbar Function Summary Function Legend Master Timeline
Vampir: Visualizationofthe NPB-MZ-MPI / BT trace Master Timeline Detailed information about functions, communication and synchronization events for collection of processes.
Vampir: Visualizationofthe NPB-MZ-MPI / BT trace Process Timeline Detailed information about different levels of function calls in a stacked bar chart for an individual process.
Vampir: Visualizationofthe NPB-MZ-MPI / BT trace Typicalprogramphases Initialisation Phase Computation Phase
Vampir: Visualizationofthe NPB-MZ-MPI / BT trace Counter Data Timeline Detailed counter information over time for an individual process.
Vampir: Visualizationofthe NPB-MZ-MPI / BT trace Performance Radar Detailed counter information over time for a collection of processes.
Vampir: Visualizationofthe NPB-MZ-MPI / BT trace Zoom in: Inititialisation Phase Context View:Detailed information about function “initialize_”.
Vampir: Visualizationofthe NPB-MZ-MPI / BT trace Feature: Find Function Execution of function “initialize_” results in higher page fault rates.
Vampir: Visualizationofthe NPB-MZ-MPI / BT trace Computation Phase Computation phase results in higher floating point operations.
Vampir: Visualizationofthe NPB-MZ-MPI / BT trace Zoom in: Computation Phase MPI communication results in lower floating point operations.
Vampir: Visualizationofthe NPB-MZ-MPI / BT trace Zoom in: FinalisationPhase “Early reduce” bottleneck.
Vampir: Visualizationofthe NPB-MZ-MPI / BT trace Process Summary • Function Summary: Overview of the accumulated information across all functions and for a collection of processes. • Process Summary:Overview of theaccumulated information across all functions and for every process independently.
Vampir: Visualizationofthe NPB-MZ-MPI / BT trace Process Summary Find groups of similar processes and threads by using summarized function information.
Summary • Vampir & VampirServer • Interactive trace visualization and analysis • Intuitive browsing and zooming • Scalable to large trace data sizes (20 TByte) • Scalable to high parallelism (200000 processes) • Vampirfor Linux, Windows and Mac OS X • Note: Vampirdoes neither solve your problems automatically nor point you directly at them. It does, however, give you FULL insight into the execution of your application.
Conclusion • performance analysis very important in HPC • use performance analysis tools for profiling and tracing • do not spend effort in DIY solutions, e.g. like printf-debugging • use tracing tools with some precautions • overhead • data volume • let us know about problems and about feature wishes • vampirsupport@zih.tu-dresden.de
Vampir is available at http://www.vampir.eu, get support via vampirsupport@zih.tu-dresden.de
Acknowledgement Staff at ZIH - TU Dresden: Ronny Brendel, HolgerBrunst, Jens Doleschal, Ronald Geisler, Daniel Hackenberg, Michael Heyde, Matthias Jurenz,Michael Kluge, Andreas Knüpfer, Matthias Lieber, HolgerMickler, HartmutMix, Matthias Weber, Bert Wesarg, Frank Winkler, Matthias Müller, Wolfgang E. Nagel