Download
1 / 23
460 likes | 1.54k Vues
Comparison of the SCS Curve Number Method to the Baseflow Separation Method for Determining Runoff over the San Marcos Basin. My Rainfall Runoff Project. Lauren Schneider CE394K.2 Surface Water Hydrology Dr. Maidment 4/28/05. Overview. Purpose and Goals Background – What are Curve Numbers?

E N D
Comparison of the SCS Curve Number Method to the Baseflow Separation Method for Determining Runoff over the San Marcos Basin My Rainfall Runoff Project Lauren Schneider CE394K.2 Surface Water Hydrology Dr. Maidment 4/28/05
Overview • Purpose and Goals • Background – What are Curve Numbers? • Data Gathered • Methodology • Curve Number Calculation • Base Flow Separation • Derivation of CN from real data • Results • Conclusions and Future Work
Purpose and Goals • Purpose – to compare the SCS CN method for calculating runoff to runoff data • Goals • Determine CNs for each watershed from land cover and hydrologic soil group data • Separate base flow for stream gage data to get runoff data • Derive CNs from runoff data • Compare CNs
What are Curve Numbers? • A curve number is an indicator of land impermeability • Uses Land Use and hydrologic soil data • Used to relate rainfall (in.) to runoff (in.) • CN can be weighted for a watershed • Generally used for small areas
Location of the Edwards Aquifer Geology and Fault Lines
Land Cover/Land Use Raster Hydrologic Soil Group
USGS Stream Gages NCDC Rain Gages
Goal 1: Determine Watershed CN Blanco River at Wimberley
81.9 84.7 84.0 82.3 83.8 Goal 1: Determine Watershed CN
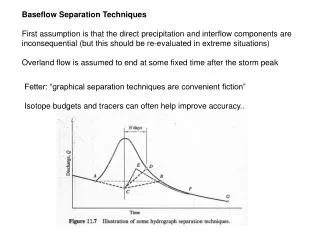
Goal 2: Base Flow Separation • Volume of runoff must be separated from stream gage data • Base flow is the discharge NOT associated with a rainfall event • Used BFI program
(Wahl, K. L., and Wahl, T. L., 1995) BFI Software • A program for determining base flow • Input comes directly from USGS stream gage data • BFI = (base flow)/(total flow) for the period • Only significant parameter is N
BFI results • The following graphs show the results of separating base flow • Stream gage data from 1995 • Monthly runoff data was calculated from the BFI results for the purpose of deriving the watershed’s CN
Precipitation Data • Monthly precipitation data was interpolated over the watersheds
Goal 3: Derive CN from Data • Monthly runoff and precipitation was used to find CNs for each watershed
Results • Base flow separation provided runoff/CN • Runoff/CN overestimated using land cover and soil group • Large variation from month to month
Conclusions • Using CN to predict runoff for a large watershed might give significant error • CN table used might overestimate • Runoff data from base flow separation not dependable for losing streams
Future Work • Research other CN tables • Use raster calculation instead of weighted CN • Use larger N for base flow separation • Determine a way to account for recharge from stream • Analyze more years of data so that a statistical analysis can be performed