Fall 2003
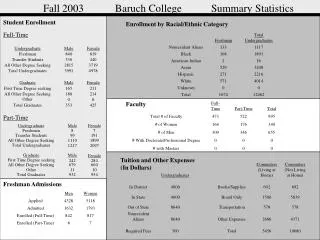
Fall 2003. Baruch College. Summary Statistics. Undergraduate. Undergraduates. Men. Women. Freshman. Full-Time. Commuters (Living at Home). Part-Time. Commuters (Not Living at Home). Total Undergraduates. Total. Male. Female. Freshman. 8. 7. Total # of Faculty. Applied.

Fall 2003
E N D
Presentation Transcript
Fall 2003 Baruch College Summary Statistics Undergraduate Undergraduates Men Women Freshman Full-Time Commuters (Living at Home) Part-Time Commuters (Not Living at Home) Total Undergraduates Total Male Female Freshman 8 7 Total # of Faculty Applied Nonresident Aliens 4328 5118 133 473 522 1117 995 Transfer Students 99 191 Black 168 1891 In District 4000 Books/Supplies 692 692 Admitted # of Women 1632 1793 164 176 340 Undergraduate Male Female All Other Degree Seeking 1110 1217 1899 2097 American Indian 2 16 Freshman # of Men Enrolled (Full-Time) 842 817 309 346 840 655 819 In State 4000 Board Only 1500 5039 Total Undergraduates Asian 529 3208 Transfer Students 336 440 Enrolled (Part-Time) # With Doctorate/Professional Degree 8 7 0 0 0 Out of State 8640 Transportation 578 578 Female Hispanic 271 2216 All Other Degree Seeking 2815 3719 # with Masters 0 0 0 Nonresident Aliens 8640 Other Expenses 2686 4371 Graduate White 571 4014 Male 242 284 Total Undergraduates 3991 4978 Required Fees 300 Total 5456 10680 First Time Degree seeking Unknown 0 0 All Other Degree Seeking Total 1674 12462 679 660 Graduate Male Female Other 11 10 First Time Degree seeking 165 211 Total Graduates 932 954 All Other Degree Seeking Other 188 214 0 0 Total Graduates 353 425 Student Enrollment Enrollment by Racial/Ethnic Category Full-Time Faculty Part-Time Tuition and Other Expenses (In Dollars) Freshman Admissions