High School Students' Views on Bullying and Harassment
190 likes | 283 Vues
Explore high school students' perspectives on bullying, harassment, and assaults, including those related to sexual orientation. Learn about students' perceptions and school staff effectiveness in addressing these issues. Gain insights from a first-year study conducted in 2009.

High School Students' Views on Bullying and Harassment
E N D
Presentation Transcript
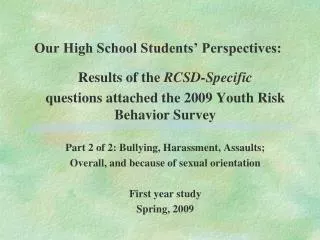
Our High School Students’ Perspectives: Results of the RCSD-Specific questions attached the 2009 Youth Risk Behavior Survey Part 2 of 2: Bullying, Harassment, Assaults; Overall, and because of sexual orientation First year study Spring, 2009
The District needs more high school perspectives on bullying, harassments and assaults, in general, as well as based on sexual orientation. • The Youth Risk Behavior Survey covers a number of aspects of harassment, assaults and bullying, but there are other important questions that have emerged that required additional survey questions. • Students have spoken at public Board of Education meetings on the problems of bullying based on sexual orientation. • RCSD has been implementing ongoing staff development to address this issue, both at the staff level and student level.
Partnership in developing bullying, harassment and assaults, both in general and from sexual orientation • RCSD has partnered with the New York City-based GLSEN (Gay, Lesbian and Straight Educational Network), a nationally-recognized advocacy organization. • GLSEN has also worked with RCSD (including Teaching and Learning and Office of Accountability) and RTA on professional development. • GLSEN provided the Office of Accountability six (6) research-based questions for the high school student survey, which is what space allowed at this time.
Our high school students report on: • Students’ appraisal on the overall seriousness of bullying, harassment and assaults • Students’ appraisal on the seriousness of bullying, harassment and assaults based on sexual orientation • Students’ appraisal on the school staff effectiveness with addressing overall bullying, harassments and assaults • Students’ appraisal on the school staff effectiveness with addressing bullying, harassments and assaults based on sexual orientation • Students’ perceptions of their own sexual orientation • Students’ inclinations to report such incidents
1. Overall, at your school, how serious of a problem is bullying, harassment, or assaults? Not serious at all 22.6% 927 Not very serious 32.9% 1,347 Somewhat serious 29.4% 1,205 Very serious 15.1% 619 Overall N = 4,098 • On the overall problem of bullying, harassment and assaults, most students (55.5%) report “not serious at all” or “not very serious.” • But conversely, over two students in five (44.5%) report either “somewhat serious” (29.4%) or “very serious” (15.1%, more than one student in seven) the problem of bullying, harassment and assaults in our high schools.
Students’ appraisal on the overall seriousness of bullying, harassments and assaults Not serious Not very Somewhat Very at allseriousseriousserious All students 22.6% 32.8% 29.5% 15.1% Male students 28.3% 32.3% 29.5% 14.1% Female students 18.2% 33.3% 32.7% 15.8% Black/African-American students 25.6% 31.0% 28.4% 14.9% Hispanic/Latina/o students 19.9% 33.1% 31.4% 15.6% White students 15.4% 42.4% 31.3% 10.9% Black/African-American females 21.2% 31.4% 31.4% 15.9% Hispanic/Latina females 15.8% 33.1% 34.9% 16.1% White females 8.8% 42.7% 38.3% 10.1% Black/African-American males 31.7% 30.5% 24.3% 13.6% Hispanic/Latino males 24.9% 33.1% 27.1% 14.9% White males 24.3% 42.0% 21.9% 11.8% Gender/ethnic N = 3,959
2. Overall, how effective is the teaching or school staff in addressing the overall problem of bullying, harassment or assaults? Very effective 22.5% 909 Somewhat effective 40.0% 1,615 Somewhat ineffective 19.8% 799 Not at all effective 17.7% 716 Overall N = 4,039 • The majority of students give teaching and school staff respectable marks for addressing the overall problem of bullying, harassment and assaults, with over three students in five (62.5%) rating “very effective” or “somewhat effective.” • Nearly two students in five (37.5%) rates teachers and staff either “somewhat ineffective” or “not at all effective”; the latter - 17.7% - is about one student in six.
Students’ appraisal on the effectiveness of school staff in addressing the overall problem of bullying, harassment and assaults Very Somewhat Somewhat Not at all effectiveeffectiveineffectiveeffective All students 22.5% 40.0% 19.8% 17.7% Male students 25.8% 37.8% 18.1% 17.2% Female students 20.0% 41.7% 21.1% 18.3% Black/African-American students 25.4% 38.9% 19.4% 17.3% Hispanic/Latina/o students 22.1% 40.8% 19.4% 17.7% White students 16.1% 45.7% 20.4% 17.9% Black/African-American females 22.2% 40.5% 20.9% 16.4% Hispanic/Latina females 19.0% 43.3% 20.8% 16.9% White females 11.6% 47.1% 24.0% 17.3% Black/African-American males 27.6% 36.7% 17.3% 18.4% Hispanic/Latino males 25.9% 37.8% 17.7% 18.6% White males 22.2% 43.7% 15.6% 18.6% Gender/ethnic N = 4,024
3. Overall, at your school, how serious of a problem is bullying, harassment or assaults on classmates who are gay, lesbian, bisexual or are perceived to be gay lesbian or bisexual? Not serious at all 31.0% 1,265 Not very serious 32.3% 1,318 Somewhat serious 22.5% 919 Very serious 14.3% 582 Overall N = 4,084 • Students are greatly divided on the problem of bullying, harassment and assaults, in relation to sexual orientation. • Over half of students (63.3%) report this problem to be “not serious at all” or “not very serious.” • But over one student in three (36.8%) report this problem to be either “somewhat serious” or “very serious” (the latter, 14.3%, is approximately one student in seven).
Students’ appraisal of seriousness of bullying, harassments and assaults based on sexual orientation or perceived sexual orientation Not serious Not very Somewhat Very at allseriousseriousserious All students 31.0% 32.3% 22.5% 14.3% Male students 33.8% 31.3% 20.9% 14.5% Female students 28.8% 33.0% 23.7% 14.0% Black/African-American students 34.0% 30.7% 20.8% 14.5% Hispanic/Latina/o students 28.0% 29.4% 25.1% 15.0% White students 28.7% 38.5% 20.7% 10.1% Black/African-American females 31.6% 31.0% 23.0% 14.4% Hispanic/Latina females 24.5% 34.0% 26.2% 15.3% White females 27.2% 41.2% 21.5% 10.1% Black/African-American males 37.1% 30.7% 20.8% 14.5% Hispanic/Latino males 32.3% 29.5% 23.7% 14.6% White males 30.8% 38.5% 20.7% 10.1% Gender/ethnic N = 4,070
4. Overall, how effective is the teaching or school staff in addressing the overall problem of bullying, harassment or assaults on classmates who are gay, lesbian, bisexual or are perceived to be gay, lesbian or bisexual? Very effective 23.6% 934 Somewhat effective 34.1% 1,350 Somewhat ineffective 18.6% 738 Not at all effective 23.7% 940 Overall N = 4,084 • Our high school students are divided over teachers and school staff in their effectiveness of addressing bullying, harassment and assaults on classmates who are gay, lesbian, bisexual or are perceived to be gay, lesbian or bisexual. • Our high school students give staff overall lower marks in this area than in general bullying, harassments and assaults. • The majority of students give higher marks (57.7% - very or somewhat). • But over two out of five (42.3%) give lower marks, and nearly one student in four rating staff “not at all effective.”
Students’ appraisal on the effectiveness of school staff in addressing problem of bullying, harassment and assaults based on sexual orientation or perceived sexual orientation Very Somewhat Somewhat Not at all effectiveeffectiveineffectiveeffective All students 23.6% 34.1% 18.6% 23.8% Male students 27.3% 32.3% 17.5% 22.7% Female students 20.7% 35.3% 19.4% 24.6% Black/African-American students 24.5% 32.0% 18.3% 25.2% Hispanic/Latina/o students 22.6% 37.8% 19.1% 20.6% White students 23.0% 39.8% 15.5% 21.7% Black/African-American females 22.5% 32.1% 18.5% 26.9% Hispanic/Latina females 18.5% 40.5% 21.1% 19.9% White females 17.1% 44.8% 16.1% 22.0% Black/African-American males 27.4% 31.7% 18.0% 22.9% Hispanic/Latino males 27.8% 34.3% 16.6% 21.3% White males 31.1% 32.9% 14.6% 21.3% Gender/ethnic N = 3,949
5. Below is a list of terms that people often use to describe their sexuality or sexual orientation. Please check all those terms that apply to you. Straight/Heterosexual 77.7% 3,108 Gay/Lesbian 6.1% 243 Bisexual 7.1% 283 Questioning 3.8% 153 Other 2.9% 117 Multiple Responses 2.6% 103 Overall N = 4,007 • This may be the most “high stakes” question on the survey. • Caution must be exercised because of “high stakes,” first-year survey (e.g. not trend data), self-reporting and reliability issues. • Nonetheless, the answers our high school students provide here is an indication of the need to more fully address issues of bullying, harassments and assaults on students based on their sexual orientation or perceived sexual orientation.
Student self-report on sexual orientation Straight/ Gay/ Multiple HeterosexualLesbianBisexualQuestioningOtherresponses All students 77.7% 6.1% 7.0% 3.8% 2.9% 2.5% Male students 76.4% 4.2% 8.0% 3.8% 3.5% 2.1% Female students 78.7% 8.5% 5.7% 3.8% 2.4% 2.9% Black/African-American students 80.1% 6.3% 7.1% 7.1% 7.1% 0.9% Hispanic/Latina/o students 77.1% 6.2% 7.6% 2.5% 3.6% 2.9% White students 78.4% 3.3% 10.3% 2.8% 1.5% 3.6% Black/African-American females 82.4% 4.3% 5.7% 3.7% 2.0% 1.9% Hispanic/Latina females 77.6% 4.8% 9.4% 2.2% 2.7% 3.4% White females 74.2% 1.8% 14.7% 4.0% 1.8% 3.6% Black/African-American males 77.1% 6.2% 7.6% 2.5% 3.6% 2.9% Hispanic/Latino males 76.5% 8.1% 5.5% 3.0% 4.7% 2.3% White males 84.1% 5.5% 4.3% 1.2% 1.2% 3.7% Caveats: Gender/ethnic N = 3,991 • This is viewed by many as a high-stakes question; • This is self-reporting; • This is a first year report, with no trend data. Why ask this question? This GLSEN question is believed to be helpful in terms of estimating the extent that bullying because of sexual orientation or perceived sexual orientation. These data establish that over one student in five (22.3%) is at potential risk of being bullied because of sexual orientation.
6. If or when you were bullied, harassed, or assaulted in school, how often did you report it to a teacher, the principal or another school staff person? Never 51.3% 2,065 Some of the time 16.9% 680 Most of the time 8.9% 359 Always 8.0% 321 Decline to answer 14.7% 588 Never + decline to answer = 66.0% Overall N= 4,013 • These data tend to confirm the belief there is a “code of silence” among our high school students. • The main caution on student reporting exists in the wording of the question: “If or when you were bullied, harassed, or assaulted in school, how often did you report it to a teacher, the principal or another school staff person?” • This is a first year report, with the attendant issues of validity and reliability.
If or when you were bullied, harassed, or assaulted in school, how often did you report it to a teacher, the principal or another school staff person? Some of Most of Decline to Neverthe timethe timeAlwaysanswer All students 51.5% 16.9% 9.0% 8.0% 14.6% Male students 54.6% 15.1% 8.4% 9.1% 13.5% Female students 49.0% 18.3% 9.7% 8.7% 15.5% Black/African-American students 53.7% 15.2% 8.3% 7.0% 15.7% Hispanic/Latina/o students 52.6% 17.5% 9.5% 8.7% 13.8% White students 49.1% 19.0% 9.3% 9.3% 13.4% Black/African-American females 50.5% 17.3% 7.5% 7.8% 16.9% Hispanic/Latina females 48.8% 18.4% 9.4% 9.9% 13.5% White females 47.5% 19.7% 9.4% 9.4% 13.9% Black/African-American males 57.9% 12.5% 9.4% 6.1% 14.1% Hispanic/Latino males 52.6% 16.4% 9.6% 7.1% 14.3% White males 51.2% 18.1% 9.0% 9.0% 12.7% Gender/ethnic N = 3,990 • Although there are some differences (more gender than ethnic overall), students across all groups are more consistent in their responses here than, for example, the academic questions.
Next steps, additional information and caveats • As in the past, provide buildings with their own information. • Buildings varied greatly in their response rates; some buildings rates are too low to be considered reliable for major decisions. (The Office of Accountability has calculated the response rates for each school.) • The Monroe County Department of Public Health has published only district-level data for all school districts that participate; RCSD releases only district-level data to the MDDPH. • The Office of Accountability has drafted a more detailed report on the data shown here, and it includes background, history and rationale, methodology, caveats and limitations, and additional possible data configurations.
More next steps, additional information and caveats • Building-level data must be used with extreme caution. • There are thousands of data points by the above configurations. • Therefore, please note the compiling and analyses are extremely labor-intensive. • Preliminary examination reveals girls outperforming boys in the academic and literacy domains, as we also see in District performance data and national trends. • The Office of Accountability intends to provide such data to the appropriate parties.
From theOffice of Accountability and partners Andrew MacGowan, Principal Writer and Editor Survey construction and editing contributors: Aloma Cason Walter Cooper, Ph.D. Emily Greytak, GLSEN (NYC) Barbara Hasler Joe Kosciw, GLSEN (NYC) Deborah Rider Jeanette Silvers, Ed.D. Youth Risk Behavior Survey – all administration duties: Robert Ulliman Lorna Washington